April 2026

DFD

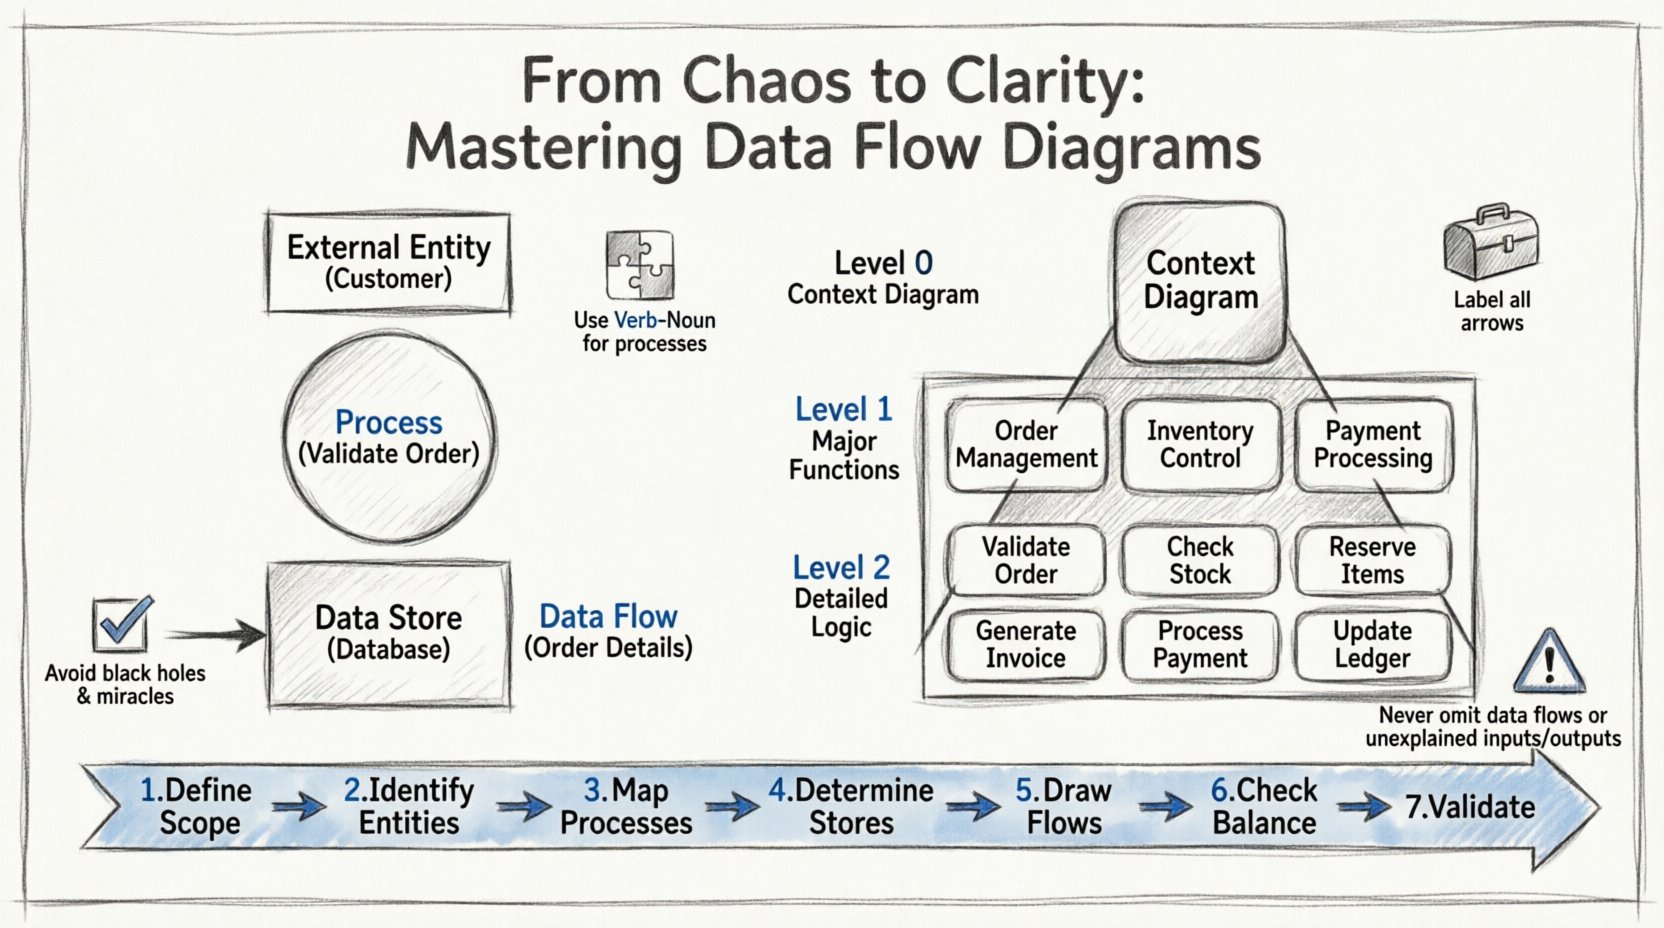
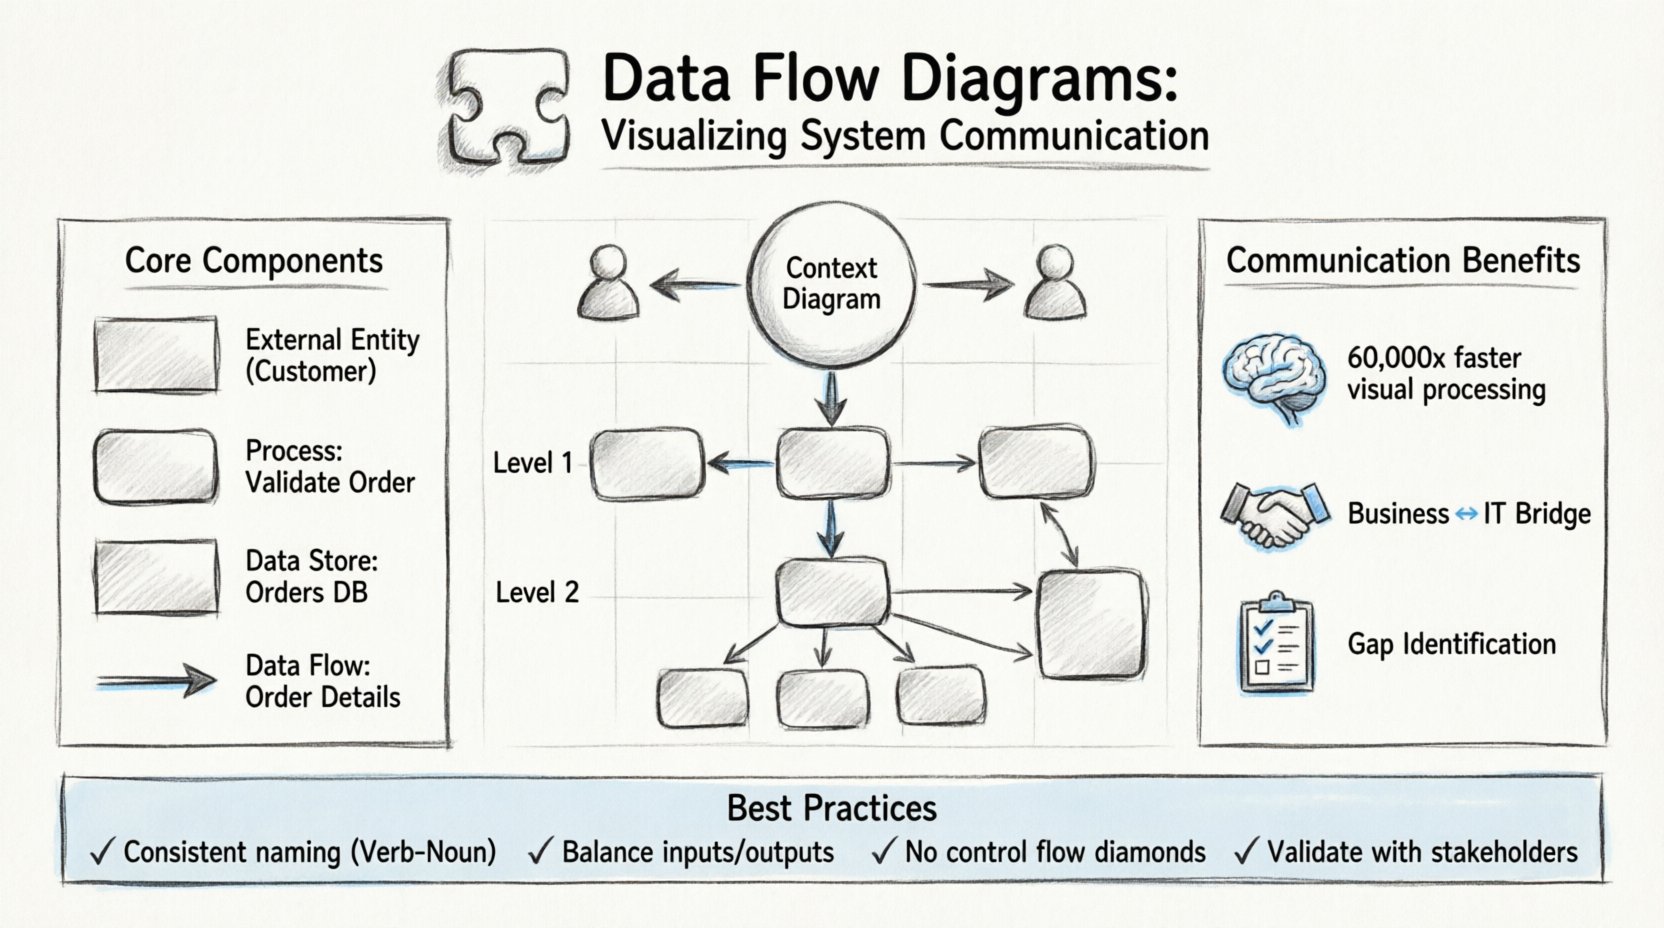
Visualizing Data: How DFDs Improve System Communication

In the complex landscape of software development and system analysis, clarity is often the missing link between a successful project and a failed one. When teams struggle to understand how information moves through an application, misunderstandings arise, leading to rework, bugs, and delayed delivery. This is where the Data Flow Diagram, commonly known as the […]

UML

Best Practices for UML Sequence Diagrams: Reducing Cognitive Load for Cross-Functional Teams

Designing interaction models for complex systems requires more than just drawing boxes and arrows. It demands a deliberate approach to visual communication that respects the limitations of human working memory. When cross-functional teams collaborate on system architecture, the diagrams they review become the primary source of truth. If these visuals introduce unnecessary friction, the cost

UML

Troubleshooting UML Modeling Errors: How to Fix Inconsistent State Transitions in Real-Time

When engineering complex real-time systems, the Unified Modeling Language (UML) serves as the blueprint for logic and behavior. However, even minor inconsistencies in state machines can lead to critical runtime failures. This guide provides a structured approach to diagnosing and resolving state transition errors without relying on specific commercial tools or marketing fluff. We focus

DFD

How to Present DFDs to Non-Technical Stakeholders Effectively

Presenting technical artifacts to business teams is a critical skill for any systems analyst or data architect. One of the most common challenges involves the Data Flow Diagram (DFD). While DFDs are powerful tools for mapping system logic, they often appear as complex charts filled with jargon to those outside the engineering department. To bridge

DFD

From Chaos to Clarity: Mastering Data Flow Diagrams in Business Analysis

In the complex landscape of business systems, information is the lifeblood that keeps operations running smoothly. However, without a clear map, data can become a tangled web that confuses stakeholders and hinders progress. This is where the Data Flow Diagram (DFD) proves its worth. It serves as a visual representation of how information moves through

DFD

Essential DFD Patterns Every Software Engineer Must Know

System architecture is not merely about code; it is about the movement of information. Data Flow Diagrams (DFDs) serve as the visual grammar for understanding how data enters a system, transforms, and exits. For software engineers, grasping these diagrams is fundamental to designing robust, scalable, and maintainable architectures. This guide explores the critical patterns and

DFD

Data Flow Diagrams: Bridging the Gap Between Business and Tech

In the intricate landscape of system design and business analysis, communication often breaks down. Stakeholders speak the language of processes and goals, while developers speak the language of databases, APIs, and code. This disconnect can lead to misaligned expectations, costly rework, and delayed timelines. The solution lies in a visual modeling technique that transcends these

DFD

Best Practices for Integrating DFDs into Your Development Lifecycle

In the intricate landscape of software architecture, clarity is the most valuable currency. Systems grow complex, and without a clear map, teams risk navigating blind spots that lead to costly refactoring and security vulnerabilities. Data Flow Diagrams (DFDs) serve as this essential map, visualizing how information moves through a system. Integrating these diagrams into the

Scroll to Top