


In the intricate landscape of software architecture, clarity is the most valuable currency. Systems grow complex, and without a clear map, teams risk navigating blind spots that lead to costly refactoring and security vulnerabilities. Data Flow Diagrams (DFDs) serve as this essential map, visualizing how information moves through a system. Integrating these diagrams into the development lifecycle is not merely a documentation exercise; it is a strategic necessity for maintaining system integrity.
This guide outlines the authoritative approach to embedding DFDs into your workflow. We will explore the structural components, the specific phases of the lifecycle where they add value, and the protocols required to keep them relevant. By adopting these practices, engineering teams can ensure that data movement is understood, validated, and optimized from the first line of code to the final deployment.
Understanding the Core Components of a DFD 🧩
Before integration begins, it is vital to establish a shared understanding of the notation. A DFD is a graphical representation of the flow of data. Unlike a flowchart, which focuses on control flow and logic, a DFD focuses on data movement. It answers the question: “Where does the data come from, where does it go, and what happens to it?”
There are four fundamental elements that constitute every Data Flow Diagram:
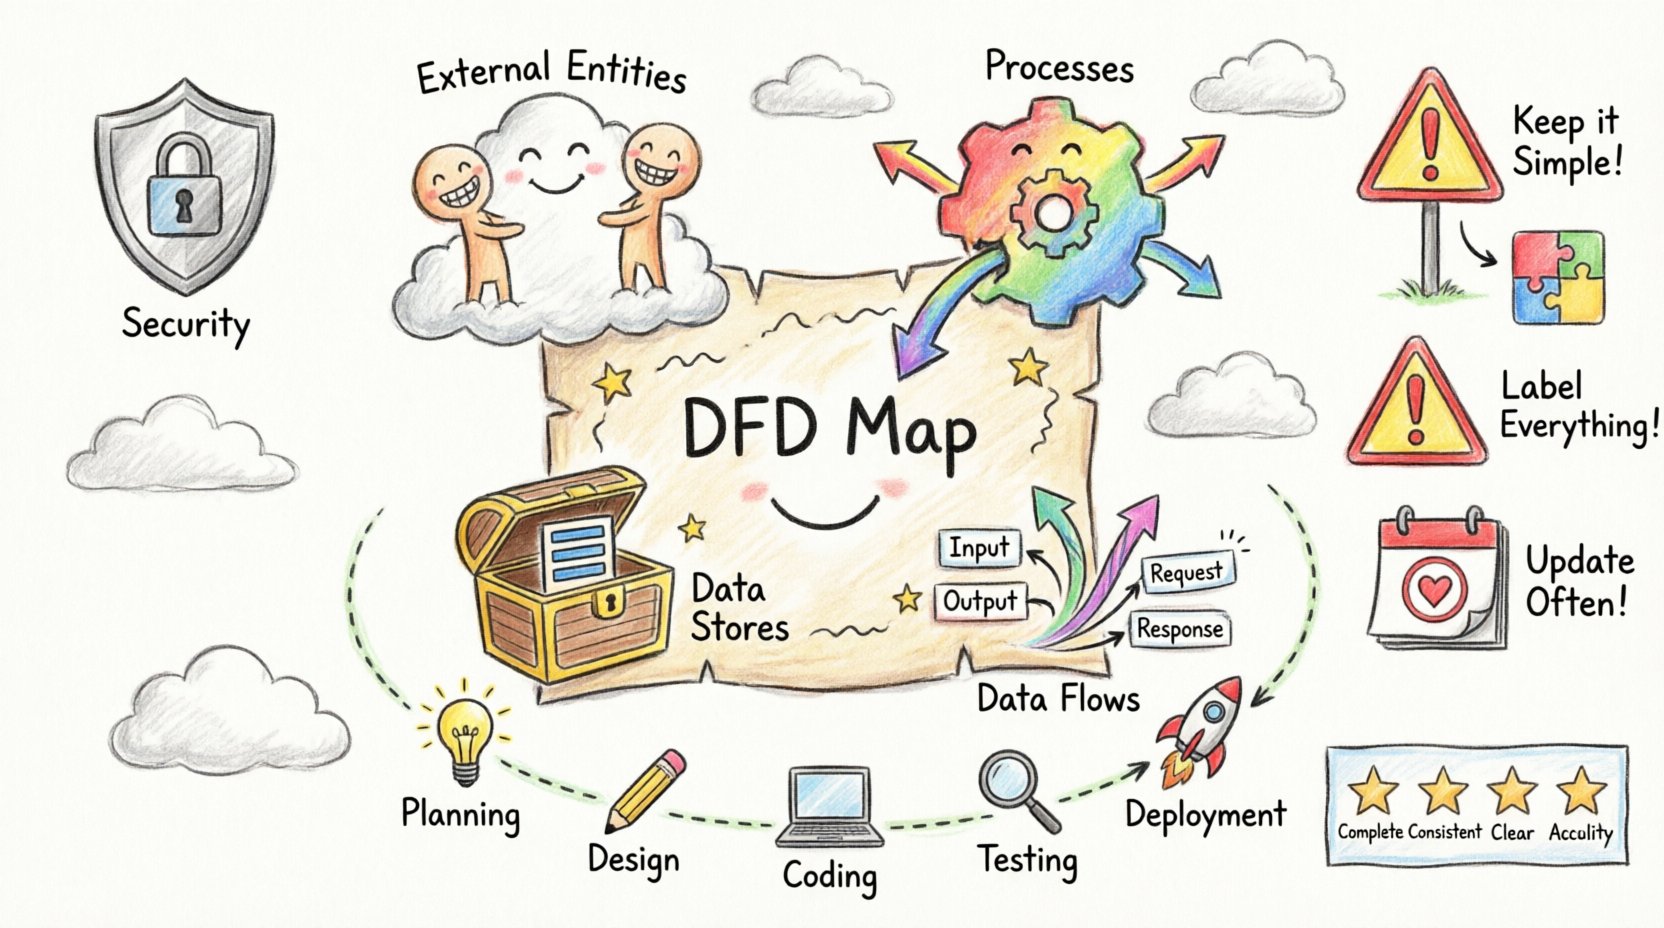
- External Entities: These represent sources or destinations of data outside the system boundaries. They could be human users, other systems, or hardware devices. They do not process data but initiate or receive it.
- Processes: These are actions that transform input data into output data. They are the engine of the system, performing calculations, updating records, or validating information. Each process must have both an input and an output to be meaningful.
- Data Stores: These represent places where data is held for later use. This includes databases, files, or temporary caches. Unlike processes, data stores do not change the data; they retain it.
- Data Flows: These are the arrows indicating the direction of data movement. They represent the transmission of data between entities, processes, and stores. Every flow must be labeled to describe the specific information being transferred.
Levels of Abstraction in System Design 📊
Effective modeling requires breaking down complexity. DFDs are typically created in a series of levels, moving from high-level overview to detailed specification. This hierarchical approach allows stakeholders to grasp the big picture before diving into implementation details.
| Level | Focus | Typical Audience |
|---|---|---|
| Context Diagram (Level 0) | System as a single process interacting with external entities. | Stakeholders, Management |
| Level 1 Diagram | Major processes and data stores identified in the system. | Architects, Lead Developers |
| Level 2 Diagram | Decomposition of specific Level 1 processes into sub-processes. | Developers, QA Engineers |
| Level 3+ Diagram | Granular detail for complex algorithms or specific modules. | Specialized Engineers |
Maintaining this hierarchy prevents cognitive overload. A single diagram containing every detail of a system becomes unreadable and loses its utility as a communication tool.
Integrating DFDs into the Development Lifecycle 🛠️
Integrating diagrams into the lifecycle requires discipline at every stage. The goal is to ensure the documentation evolves alongside the code, rather than becoming obsolete immediately after release.
1. Planning and Requirements Phase
The initial phase is where the Context Diagram proves most valuable. It defines the system boundary. By mapping external entities early, the team establishes what is inside the system and what is outside. This distinction is critical for security and integration points.
- Define Boundaries: Clearly mark what the system controls versus what it accesses.
- Identify Inputs: List all data sources required to operate the system.
- Identify Outputs: Determine what data must be delivered to users or other systems.
This phase sets the scope. If a data flow is not accounted for in the Context Diagram, it should be flagged as a potential scope creep or a requirement gap.
2. Analysis and Design Phase
This is the core phase for DFD creation. The Level 1 and Level 2 diagrams are drafted here. The focus shifts from “what” to “how.” Processes are broken down, and data stores are defined.
Best Practices for this Phase:
- Consistency is Key: Ensure that inputs and outputs match between levels. If a Level 1 process outputs “User Data,” the corresponding Level 2 processes must accept “User Data” as input.
- Validate Data Stores: Ensure every data store is backed by at least one process that writes to it and one that reads from it. Orphaned data stores lead to maintenance nightmares.
- Check for Black Holes and Miracles: A “Black Hole” is a process with inputs but no outputs. A “Miracle” is a process with outputs but no inputs. Both indicate logical errors in the design.
3. Implementation Phase
During coding, developers should reference the detailed diagrams. The DFD acts as a specification for the database schema and the API endpoints. While code is the implementation, the diagram is the blueprint.
- Traceability: Code modules should be traceable back to specific processes in the diagram. This aids in debugging and understanding the purpose of specific functions.
- API Design: Data flows in the diagram often map directly to API requests and responses. Using the diagram to design the interface ensures consistency.
4. Testing Phase
QA engineers use the DFD to design test cases. If a data flow exists on the diagram, it must be tested. This ensures that data integrity is maintained across all paths.
- Path Coverage: Test cases should cover every data flow to verify that information reaches its destination correctly.
- Boundary Testing: Focus on the interfaces between external entities and the system to ensure data is handled correctly at the boundaries.
5. Deployment and Maintenance Phase
Many teams neglect diagrams after deployment. However, maintenance is where DFDs provide long-term value. When a bug is reported or a feature is added, the diagram guides the impact analysis.
- Version Control: Diagrams should be versioned alongside code. A new version of the software requires a corresponding version of the diagram.
- Impact Analysis: Before changing a data store, review the diagram to see which processes depend on it. This prevents breaking existing functionality.
Collaboration and Communication 🤝
DFDs are a universal language. They bridge the gap between technical and non-technical stakeholders. However, their effectiveness depends on how they are used in collaboration.
Facilitating Cross-Functional Dialogue
Business analysts, developers, and product managers often speak different languages. A DFD provides a neutral ground. A business analyst can point to a data flow and say, “This information is required for compliance.” A developer can see the process and say, “This requires encryption at rest.” The diagram visualizes the requirement and the technical constraint simultaneously.
Roles and Responsibilities
| Role | Responsibility regarding DFDs |
|---|---|
| Business Analyst | Define requirements, validate external entities, ensure data needs are met. |
| System Architect | Define high-level structure, ensure logical consistency across levels. |
| Developer | Implement processes, ensure code matches diagram flows, update diagrams post-refactor. |
| QA Engineer | Use diagrams to derive test paths and validate data integrity. |
| DevOps | Understand deployment flows and data storage requirements for infrastructure. |
Common Pitfalls and How to Avoid Them ⚠️
Even experienced teams fall into traps when modeling data flow. Recognizing these pitfalls early saves significant time and effort.
| Pitfall | Description | Solution |
|---|---|---|
| Over-Complexity | Putting too much detail on one diagram, making it unreadable. | Use decomposition. Break complex processes into sub-diagrams. |
| Control Flow Confusion | Using DFDs to show decision logic (if/else) instead of data movement. | Use flowcharts or state diagrams for logic. Keep DFDs focused on data. |
| Missing Data Stores | Assuming data is processed in memory without persistence. | Explicitly define where data is stored, even if temporary. |
| Static Documentation | Creating diagrams once and never updating them. | Integrate diagram updates into the definition of done for user stories. |
| Unclear Labels | Data flows are unnamed or vaguely labeled (e.g., “Data”). | Use specific nouns (e.g., “Customer Order,” “Invoice Record”). |
Maintaining Diagram Integrity 🛡️
A DFD is a living document. As the system evolves, the diagram must evolve. To maintain integrity, establish a protocol for updates.
- Change Control: Any change to the system architecture that affects data movement should trigger a review of the DFD.
- Regular Audits: Schedule periodic reviews where the diagram is compared against the actual system behavior.
- Tooling: Use diagramming tools that allow for easy editing and version history. Avoid hard-coded images that are difficult to modify.
- Accessibility: Ensure the diagrams are accessible to the entire team. Centralize them in a shared knowledge base rather than individual local drives.
Logical vs. Physical DFDs 🧠
It is important to distinguish between Logical and Physical DFDs. Both are useful, but they serve different purposes.
- Logical DFD: Focuses on the business processes and data flows independent of technology. It answers “What is the system doing?” This is used early in the lifecycle to validate business requirements.
- Physical DFD: Focuses on the implementation details. It specifies the technology, hardware, and specific software modules. It answers “How is the system doing it?” This is used during the design and implementation phases.
Mixing these two can lead to confusion. Business stakeholders may not care about the database technology (Physical), but developers cannot build without it. Keep the models distinct but linked.
Data Validation and Security Considerations 🔒
Security is not an afterthought. DFDs can be used to identify security risks by highlighting where sensitive data travels.
- Identify Sensitive Flows: Mark flows containing Personally Identifiable Information (PII) or financial data.
- Encryption Points: Ensure that sensitive data flows are encrypted in transit between processes and entities.
- Access Control: Verify that external entities are only receiving data they are authorized to access. Check data stores to ensure they are protected.
- Compliance: Regulatory requirements often mandate data lineage. DFDs provide the visual proof of where data originates and where it is stored.
Metrics for DFD Quality 📏
To ensure your diagrams are effective, apply quality metrics. A diagram is not good just because it looks nice; it must be useful.
- Completeness: Are all required data flows accounted for?
- Consistency: Do the inputs and outputs match across all decomposition levels?
- Clarity: Can a new developer understand the flow within 10 minutes?
- Accuracy: Does the diagram reflect the current state of the system?
Final Thoughts on System Design 🚀
Integrating Data Flow Diagrams into your development lifecycle is a commitment to clarity. It requires upfront effort, but the return on investment is a system that is easier to understand, maintain, and secure. By following these best practices, you ensure that your team is not just writing code, but designing systems with intention.
Start with the context. Break down the complexity. Keep the documentation alive. And always remember that the diagram is a tool for thinking, not just a product for display. When your data flows are clear, your development process becomes smoother, your communication becomes sharper, and your final product stands on a foundation of solid architecture.
Adopt these practices today to build better software for tomorrow. The effort invested in mapping the data is the effort saved in debugging the system.