


Modeling the temporal behavior of complex systems requires a tool capable of expressing not just what happens, but when it happens. The Unified Modeling Language (UML) Timing Diagram provides this specific capability. Unlike Sequence Diagrams, which focus on the logical ordering of messages, Timing Diagrams emphasize the lifecycle of objects and the strict timing constraints associated with real-time interactions. This guide details the structural and semantic best practices required to model real-time systems accurately without introducing ambiguity.
Real-time systems, from embedded automotive controllers to telecommunications infrastructure, depend on predictability. A system that functions logically but fails to meet a deadline is often a failure in the real world. Therefore, the precision captured in a Timing Diagram is not merely a graphical preference; it is a critical specification artifact. This document outlines the authoritative standards for constructing these diagrams to ensure they serve as reliable blueprints for development and verification.
🧩 Understanding the Anatomy of a Timing Diagram
Before applying best practices, one must understand the core components that constitute a valid Timing Diagram. The UML specification defines specific notations that distinguish these diagrams from other behavioral models.
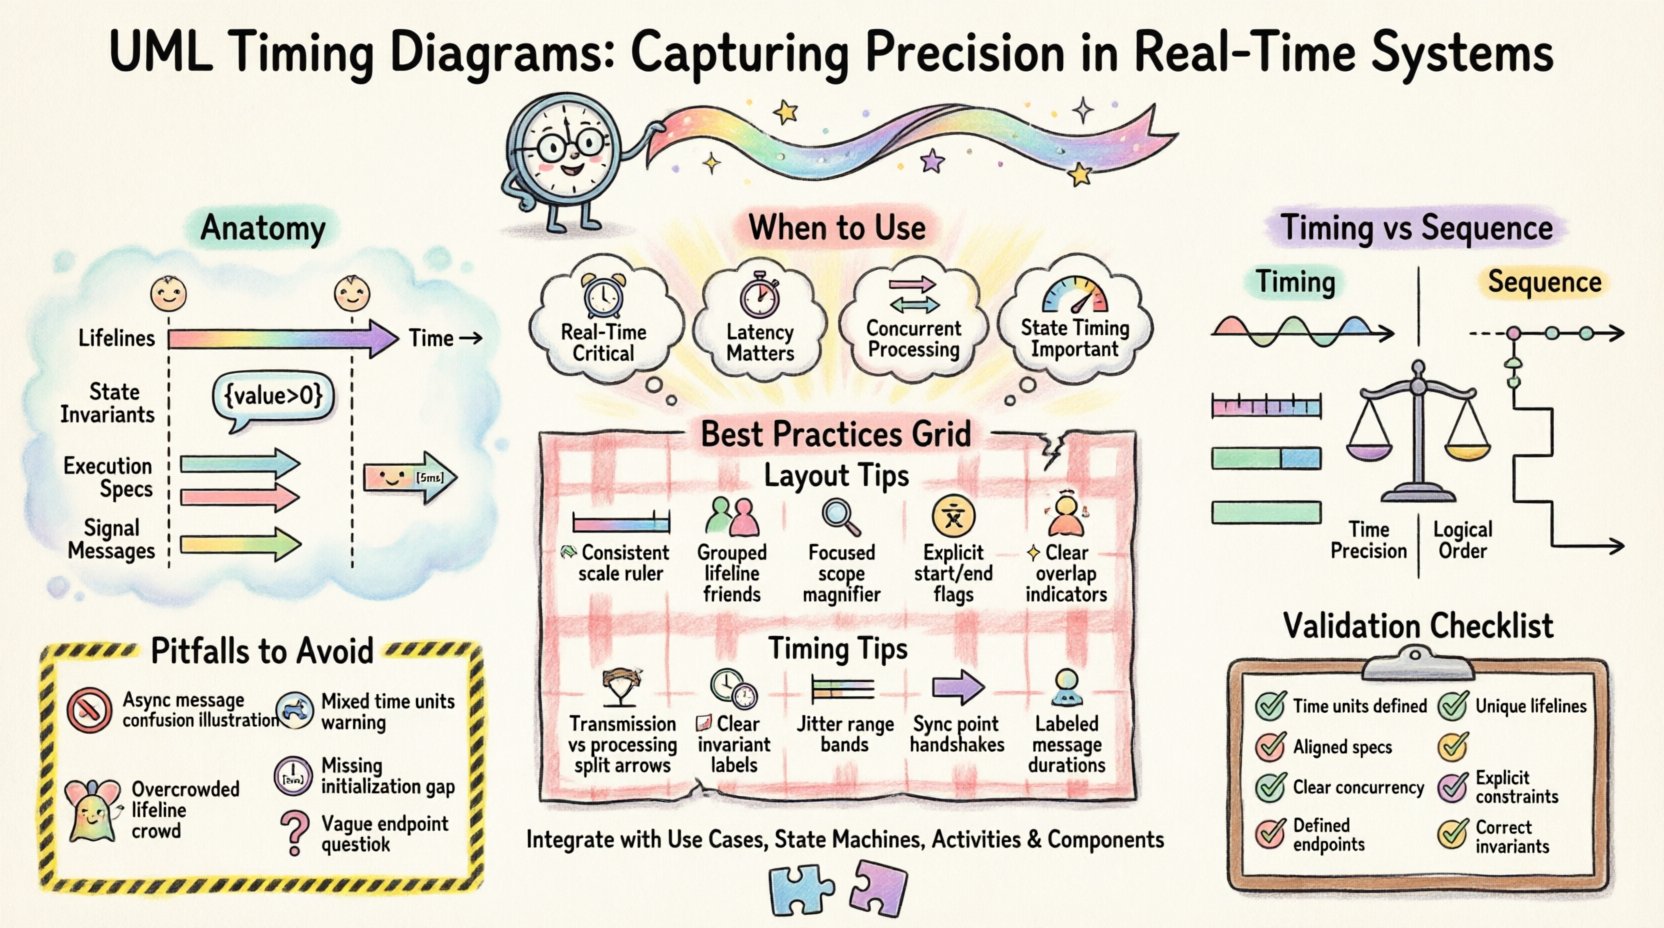
- Lifelines: Vertical lines representing the existence of an object or participant over time. Each lifeline corresponds to a specific instance or class role within the system.
- Time Axis: A horizontal axis indicating the progression of time. Unlike Sequence Diagrams, time flows explicitly from left to right.
- State Invariants: Conditions that must hold true for an object during a specific period. These are often represented as text boxes floating above or below the lifeline, enclosed in curly braces.
- Execution Specifications: Rectangular bars placed on a lifeline indicating the period during which an object is performing an action or is in a specific state.
- Signal Messages: Arrows connecting lifelines to denote the transmission of a signal. In timing diagrams, these are annotated with their delivery and processing times.
Understanding these elements is the foundation. Without a clear grasp of how execution specifications overlap with time intervals, the diagram loses its predictive value.
⏱️ When to Use Timing Diagrams
Not every interaction requires a Timing Diagram. Overuse can lead to model bloat and confusion. Use this artifact when:
- Real-Time Constraints are Critical: When system correctness depends on meeting deadlines (e.g., hard real-time).
- Latency and Response Times Matter: When the duration between a stimulus and a reaction is a key requirement.
- Parallel Processing Exists: When multiple objects must interact concurrently, and their synchronization points are vital.
- State Duration is Important: When the length of time an object remains in a specific state affects system behavior.
For general functional flow where time is irrelevant, a Sequence Diagram or Activity Diagram is often more appropriate. Timing Diagrams should be reserved for scenarios where the clock is a primary actor.
📐 Best Practices for Structure and Layout
The visual arrangement of a Timing Diagram significantly impacts its readability. A cluttered diagram obscures timing relationships. The following practices ensure clarity.
1. Maintain Consistent Time Scaling
Time should not be relative within a single diagram unless explicitly noted. If the diagram specifies milliseconds, do not switch to seconds midway without a clear break or annotation. Consistent scaling allows engineers to visually estimate durations without constant calculation.
2. Group Related Lifelines
Place lifelines that interact frequently or belong to the same subsystem adjacent to one another. This reduces the number of crossing arrows, making the flow of control easier to trace. Use swimlanes or grouping boxes if the diagram becomes too wide.
3. Limit the Scope
A single diagram should not attempt to capture the entire system lifecycle. Break down complex behaviors into specific scenarios. A diagram focusing on a “Timeout Recovery” sequence is more useful than one attempting to show the “Full Boot Process”.
4. Use Explicit Start and End Times
Whenever possible, define absolute start and end times for execution specifications. Relative times (e.g., “after message received”) are acceptable but can lead to ambiguity in complex chains. Absolute time anchors the diagram to a specific timeline.
5. Avoid Overlapping Execution Specifications
While concurrent execution is valid, overlapping bars that are not synchronized can be confusing. Ensure that any overlap represents a known state of parallelism. If two processes run simultaneously, explicitly mark the synchronization points.
⚙️ Best Practices for Timing and Events
The semantic accuracy of the timing data is more important than the visual layout. The following practices ensure the data reflects reality.
1. Distinguish Between Transmission and Processing Time
Communication latency is not the same as processing time. Clearly differentiate the time taken for a message to travel across the network (transmission) versus the time the receiver takes to handle it (processing). Use distinct markers or annotations for these values.
2. Define State Invariants Clearly
State invariants should be concise. Instead of a paragraph, use logical expressions (e.g., value > 0). Place these invariants directly above the lifeline segment where they apply. If a state changes, update the invariant immediately.
3. Account for Jitter and Variability
Real-world systems rarely operate with perfect precision. If a timing constraint allows for variance (jitter), represent this using ranges or dashed lines rather than solid, absolute lines. This prevents the model from being invalidated by minor fluctuations.
4. Synchronize Parallel Threads
If multiple lifelines represent parallel threads, use synchronization signals to indicate when they must align. A Timing Diagram is the best place to show a “wait” state where one thread pauses for another to complete an action.
5. Label Message Arrows with Timing Data
Do not rely on visual distance to convey time. Label message arrows with specific durations (e.g., [5ms]). This ensures that the diagram remains accurate even if the layout is adjusted later.
📊 Comparison: Timing vs. Sequence Diagrams
It is common to confuse Timing Diagrams with Sequence Diagrams. While they share lifelines and messages, their focus differs significantly. The table below highlights the distinctions to help you choose the right tool.
| Feature | Timing Diagram | Sequence Diagram |
|---|---|---|
| Primary Focus | Time duration and state changes | Order of messages and logic |
| Time Axis | Explicit, continuous, and measurable | Implicit, discrete steps |
| State Representation | State invariants and execution specs | Minimal state focus |
| Concurrency | Shows duration of parallel activity | Shows logical ordering of parallel steps |
| Use Case | Real-time constraints, embedded systems | General interaction flow, logic validation |
🚫 Common Pitfalls and How to Avoid Them
Even experienced modelers make mistakes when translating temporal logic into diagrams. Recognizing these pitfalls early saves significant rework.
Pitfall 1: Ignoring Asynchronous Messages
Asynchronous messages do not block the sender. In a Timing Diagram, the sender’s execution specification should continue without interruption after sending the message. Do not draw the sender’s bar ending until it completes its local action.
Pitfall 2: Inconsistent Time Units
Using milliseconds in one section and seconds in another is a recipe for calculation errors. Define the unit at the top of the diagram (e.g., Time: ms) and stick to it.
Pitfall 3: Overloading Lifelines
A lifeline should not represent multiple unrelated objects. If two distinct entities need to be tracked, create separate lifelines. Merging them obscures the specific timing of each.
Pitfall 4: Missing Initialization Times
Many diagrams start with an implicit “time zero.” If the system has a boot-up sequence or initialization delay, this must be represented before the first interaction occurs. Failing to do so creates a false impression of immediate availability.
Pitfall 5: Vague Endpoints
A diagram that ends abruptly without defining the final state leaves the verification team guessing. Ensure every lifeline ends with a clear termination or a return to an idle state.
🔗 Integrating with Other UML Artifacts
A Timing Diagram does not exist in isolation. It is part of a larger system model. Integrating it with other diagrams ensures consistency.
- Use Case Diagrams: Identify which use cases involve time constraints. These are candidates for Timing Diagrams.
- State Machine Diagrams: The duration of a state in a State Machine can be modeled as an execution specification in a Timing Diagram. Ensure the state entry and exit times align.
- Activity Diagrams: Use Activity Diagrams for the flow of logic, and Timing Diagrams for the temporal constraints of that flow. They complement each other.
- Component Diagrams: Map the lifelines in the Timing Diagram to specific components in the Component Diagram. This helps verify that the right hardware or software modules are responsible for the timed actions.
🛡️ Validation Checklist
Before finalizing a Timing Diagram, use the following checklist to validate the model against best practices.
| Check Item | Pass Criteria |
|---|---|
| Time Units Defined? | Explicit unit (ms, s, µs) stated on the time axis. |
| Lifelines Unique? | No lifeline represents multiple disjoint objects. |
| Execution Specs Aligned? | Bars align with message arrows and state changes. |
| Concurrency Clear? | Parallel activities are visually distinct and labeled. |
| End States Defined? | Every lifeline has a clear start and end point. |
| Constraints Explicit? | Timing constraints are labeled with values, not just visual distance. |
| State Invariants Correct? | Invariants match the state active during the time period. |
📝 Advanced Considerations for Complex Systems
As systems grow in complexity, standard timing diagrams may require advanced techniques to remain useful.
1. Hierarchical Timing Diagrams
For large systems, a single diagram becomes unreadable. Use hierarchical modeling where a complex interaction is encapsulated in a sub-diagram. The parent diagram shows the trigger, and the child diagram details the timing.
2. Resource Constraints
Real-time systems often face resource limits (CPU, memory). If a delay is caused by resource contention rather than logic, annotate the execution specification to indicate the cause. This helps developers distinguish between algorithmic slowness and hardware bottlenecks.
3. Interrupt Handling
Interrupts can disrupt the normal flow of a lifeline. Represent interrupt signals as distinct arrows that cut across execution specifications. Clearly show when the system resumes normal processing after the interrupt is handled.
🔄 Moving Forward
The creation of a UML Timing Diagram is an exercise in precision. It requires a deep understanding of the system’s temporal requirements and the discipline to represent them faithfully. By adhering to these best practices, you ensure that the diagram serves its purpose: providing a clear, unambiguous specification of time-dependent behavior.
Remember that models are living documents. As system requirements evolve, the timing constraints may change. Keep the diagram synchronized with the code and the requirements. Regular reviews should focus not just on the logic, but on the timing assumptions. If a constraint is violated in testing, the diagram must be updated to reflect the new reality.
Ultimately, the value of a Timing Diagram lies in its ability to prevent defects before they occur. By visualizing the clock, you make time a tangible part of the design process. This proactive approach is essential for building robust, real-time systems that perform reliably under pressure.
Focus on clarity, consistency, and accuracy. With these principles, your timing diagrams will stand as authoritative references for your entire development lifecycle.