


Data Flow Diagramming (DFD) remains a cornerstone of structured system analysis. It provides a visual representation of how information moves through a system, identifying processes, data stores, external entities, and the data flowing between them. Despite its widespread adoption, creating a precise and functional DFD requires rigorous adherence to established conventions. Deviations from these norms can lead to ambiguity, implementation errors, and maintenance nightmares.
Many analysts focus heavily on the aesthetic layout of the diagram, neglecting the logical integrity of the data flows. A beautiful diagram that violates fundamental rules is functionally useless. This guide examines the most frequent errors encountered during the modeling phase and provides actionable strategies to resolve them. By understanding these pitfalls, teams can ensure their system specifications are accurate, unambiguous, and ready for development.
Understanding the Foundation: Data Conservation 🔄
Before diving into specific errors, it is essential to grasp the principle of data conservation. In a valid Data Flow Diagram, data cannot simply appear or disappear. Every input entering a process must result in some form of output. While the data may be transformed, stored, or discarded logically, the flow must remain traceable. This principle acts as the bedrock for identifying the pitfalls discussed below.
When constructing a DFD, think of the system as a factory. Raw materials (inputs) enter the assembly line (processes), are modified, and finished goods (outputs) leave the factory. If raw materials enter a machine but nothing leaves, the machine is broken. Similarly, if a process in your diagram receives data but produces none, the logic is flawed.
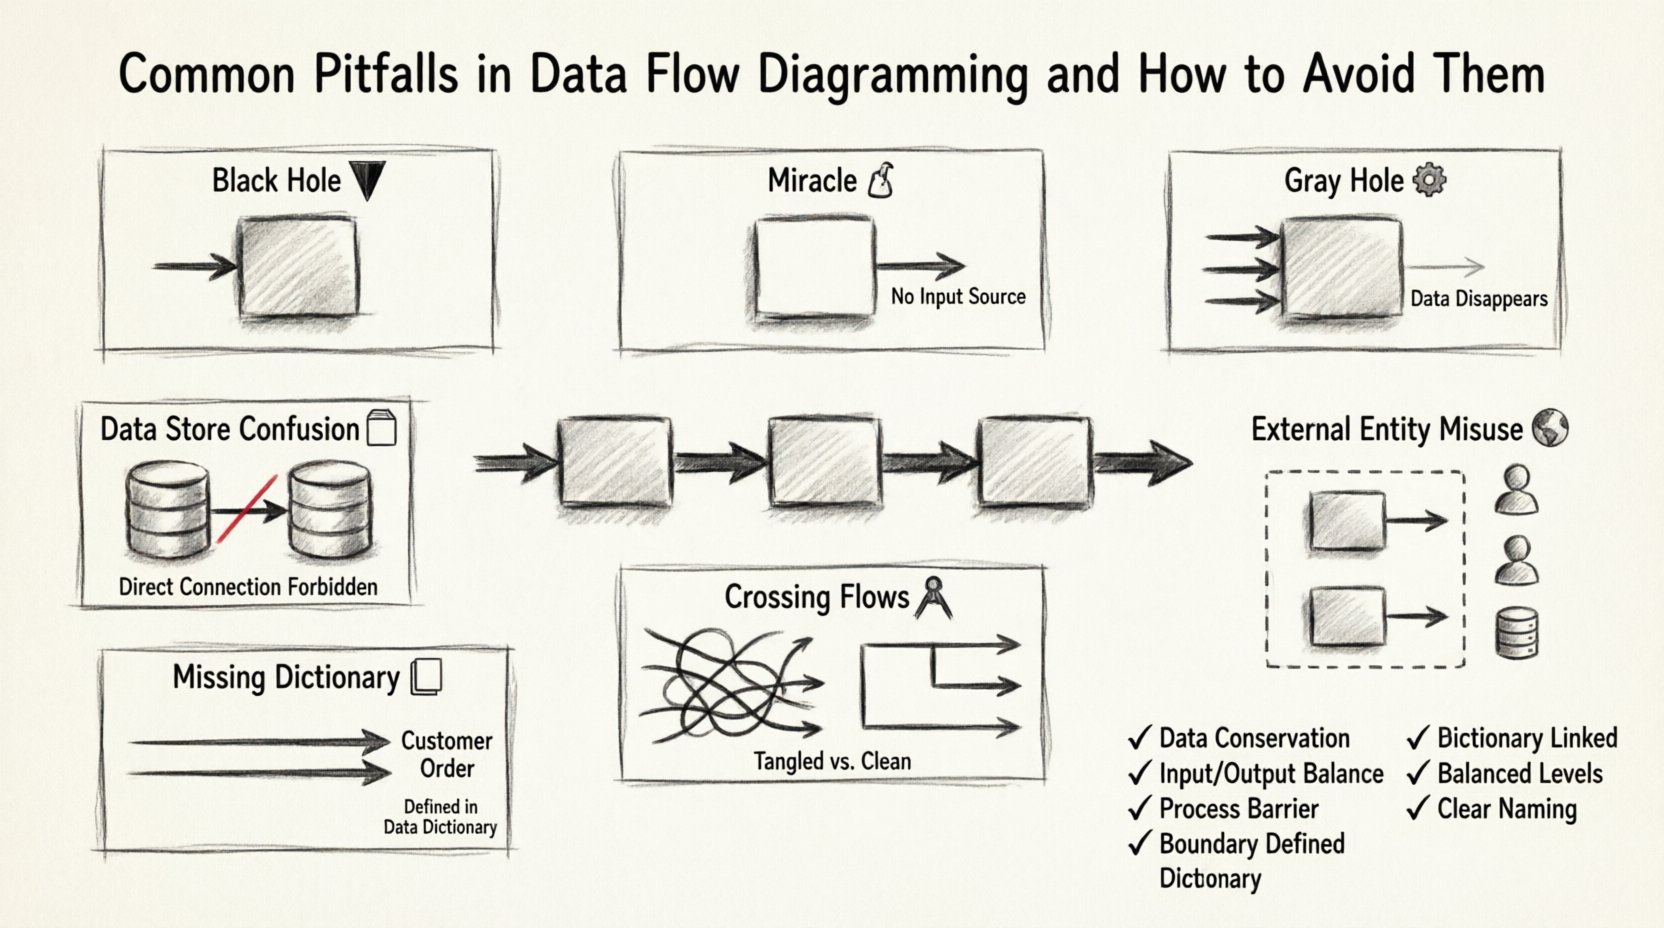
Pitfall 1: The Black Hole Process 🕳️
A Black Hole occurs when a process has input data flows but no output data flows. This suggests that data enters the system, gets “lost” inside the process, and generates no result. This is a logical impossibility in functional modeling.
Why It Happens
- Incomplete Requirements: The analyst may not have fully defined the output actions associated with a specific process.
- Over-Abstraction: The process is defined too broadly, masking the specific outputs required.
- Focus on Inputs: The modeler focuses on what triggers the process but forgets what the process produces.
The Consequence
Developers encountering a Black Hole in the specifications will be forced to guess the output. This leads to assumptions that often differ from stakeholder expectations. In database design, this might manifest as tables receiving data but never being queried or updated, leading to data accumulation without utility.
How to Avoid It
- Ask “So What?”: For every input arrow entering a process, ask “What happens to this data?”
- Define Outputs Explicitly: Ensure every process has at least one output flow.
- Review Logic: If a process is a “Delete” operation, ensure the output indicates the record status change or a confirmation message, even if no data is returned.
Pitfall 2: The Gray Hole Process ⚙️
A Gray Hole is a process where the outputs are significantly less than the inputs. The data flows in, but the transformation is insufficient to justify the input volume. Essentially, the process consumes more data than it produces, or the output does not logically derive from the input.
Example Scenario
Imagine a process named “Calculate Total.” It receives inputs for “Price,” “Quantity,” “Tax Rate,” “Shipping Cost,” “Discount Code,” “Customer Name,” and “Billing Address.” It only produces an output of “Total Price.”
While not a Black Hole, this is a Gray Hole. The inputs for Customer Name, Billing Address, and Discount Code are consumed but not reflected in the single output. This implies data is being discarded without a clear reason, or the process is actually a collection of multiple smaller processes.
How to Avoid It
- Balance Inputs and Outputs: Ensure the data content in the output matches the complexity of the input.
- Decompose: If a process has too many inputs and too few outputs, split it into smaller, more focused sub-processes.
- Check Data Stores: If data is being stored rather than passed on, ensure there is a data store arrow pointing to it.
Pitfall 3: The Miracle Process 🧙♂️
A Miracle Process is a process that produces outputs without any inputs. It implies that the system can generate information out of thin air. In reality, all data must originate from somewhere—either an external entity or a data store.
Common Causes
- Assumed Knowledge: Assuming the system “knows” a value without defining where it comes from.
- Initialization Logic: Forgetting the initialization step where default data is loaded into the system.
- Timing Errors: Modeling a process that runs periodically without acknowledging the trigger or data source.
How to Avoid It
- Trace Every Output: Follow every output arrow backward. Does it connect to an input, a data store, or an external entity?
- Identify Sources: If data appears without a source, identify the initial data entry point or the configuration store.
- Refine Labels: Change the process name to reflect that it is retrieving or generating data based on specific triggers.
Pitfall 4: Data Store Confusion 🗄️
Data stores represent repositories where information is kept for future use. A common error involves the direction of data flows between processes and data stores.
The Rules
- Read Operations: A process must read from a data store to use the data. The arrow points from the store to the process.
- Write Operations: A process must write to a data store to save data. The arrow points from the process to the store.
- Direct Store-to-Store: Data should never flow directly from one data store to another without passing through a process first.
Why It Matters
Allowing direct flow between stores implies a physical database link that bypasses business logic. This breaks the separation of concerns. Business rules (validation, calculation, formatting) must happen in the process, not in the storage mechanism.
How to Avoid It
- Enforce the Process Barrier: Never draw a line connecting two data store symbols directly.
- Validate Flow Direction: Ensure arrows pointing to a store represent writes (saving) and arrows pointing away represent reads (retrieving).
- Check for “Ghost” Reads: Ensure that if data is stored, there is a corresponding process defined to retrieve it later.
Pitfall 5: External Entity Misuse 🌍
External entities are sources or destinations of data outside the system boundary. Common mistakes include treating them as internal processes or failing to define the boundary clearly.
Common Errors
- Internalizing External Actors: Modeling a human user as an internal process. Users are external; the system processes their inputs.
- Missing Boundary: Not drawing a clear box or boundary that defines what is inside the system and what is outside.
- Bi-directional Confusion: Assuming all external entities both send and receive data. Some may only receive (e.g., a generated report sent to a printer).
Best Practices
- Define the System Boundary: Visually enclose all processes and data stores. Anything outside this box is an entity.
- Standardize Naming: Use nouns for entities (e.g., “Customer,” “Tax Authority”) and verbs for processes (e.g., “Calculate,” “Validate”).
- Limit Scope: Only include entities that interact directly with the system. Do not include entities that only interact with other external entities.
Pitfall 6: Crossing Data Flows 🚧
2While not a logical error, crossing lines (where one data flow line crosses another without an intersection point) makes the diagram difficult to read and prone to misinterpretation. It obscures the path of information.
Impact on Maintenance
When diagrams are dense with crossing lines, auditors and developers struggle to trace a specific data path. This increases the time required for code reviews and bug tracking.
How to Avoid It
- Reposition Elements: Move processes and entities around until lines can run parallel or orthogonal without crossing.
- Use Jumps: If crossing is unavoidable, use a standard notation to indicate a line going over another, though avoidance is preferred.
- Group Related Flows: Cluster processes that exchange data frequently to minimize the span of the diagram.
Pitfall 7: Ignoring Data Dictionaries 📖
A Data Flow Diagram shows the *movement* of data, but not the *content* of the data. Relying solely on the DFD without a Data Dictionary leads to ambiguity.
The Problem
Two different processes might use a data flow labeled “Customer Info.” In one process, it might include a name and address. In another, it might include a credit score and ID. Without a dictionary defining the exact composition of data, developers will implement inconsistent data structures.
Best Practices
- Define Every Flow: Ensure every data flow has a corresponding entry in the Data Dictionary.
- Specify Structure: List the constituent data elements for every flow (e.g., “Customer Info = Name + Address + ID”).
- Update Regularly: Treat the dictionary as a living document. If the DFD changes, the dictionary must change simultaneously.
Leveling and Decomposition 📉
A frequent issue arises when analysts fail to properly decompose a Context Diagram into lower-level diagrams (Level 0, Level 1, etc.). This results in a model that is either too high-level to be useful or too low-level to be manageable.
The Balancing Act
The principle of Balancing requires that the inputs and outputs of a parent process in a higher-level diagram must match the inputs and outputs of the child processes in the lower-level diagram. If you decompose a process, the sum of the child flows must equal the parent flow.
Common Violations
- Missing Inputs: A child process has an input that the parent process did not show.
- Extra Outputs: A child process produces data that the parent process does not output.
- Lost Data: Data flows through a decomposition but disappears between levels.
How to Ensure Balance
- Copy Parent Flows: When creating a child diagram, start by copying the input and output arrows from the parent process.
- Trace Connections: Verify that every data store accessed in the child level is accessible from the parent context.
- Review Iteratively: Compare Level 0 and Level 1 diagrams side-by-side to ensure flow conservation.
Validation Checklist ✅
Before finalizing a Data Flow Diagram, use the following checklist to verify logical integrity. This table summarizes the critical checks required for a robust model.
| Check | Requirement | Failure Consequence |
|---|---|---|
| Conservation of Data | No data appears or disappears | Black or Gray Holes |
| Process Count | Every process has input and output | Logic gaps |
| Data Store Flow | Processes read/write to stores, not store-to-store | Bypassed logic |
| External Entities | Defined outside system boundary | Scope creep |
| Data Dictionary | All flows defined structurally | Implementation ambiguity |
| Balancing | Child inputs/outputs match parent | Level inconsistency |
| Naming | Verbs for processes, Nouns for data | Confusion in communication |
Reviewing and Validating Your DFD 🔍
Once the diagram is drawn, the review process is critical. Do not rely solely on the creator for validation. A fresh pair of eyes can spot logical breaks that the creator has become blind to.
Walkthrough Strategy
Conduct a walkthrough where stakeholders trace a specific data item from entry to exit. For example, trace a “Payment Order” from the moment it enters the system until it is recorded in the ledger.
- Trace the Path: Follow the arrows physically with a finger or cursor.
- Question the Stops: At every process, ask if the transformation makes sense.
- Verify the Storage: Confirm that data is saved where it needs to be remembered.
- Check the End: Ensure the data reaches an external entity or a final state.
Stakeholder Feedback
Present the DFD to business users. They may not understand the technical notation, but they understand the business flow. If a user looks at a process and says, “We don’t actually do that step,” the diagram must be corrected. Their understanding of the business reality trumps the modeler’s assumption.
Iterative Refinement 🛠️
Data Flow Diagramming is rarely a linear task. It is an iterative cycle of modeling, reviewing, and refining. Early drafts will contain errors. This is normal. The goal is to refine the model until it accurately reflects the system’s logic.
Do not hesitate to redraw a diagram if it becomes too cluttered. It is better to have multiple focused diagrams than one massive, unreadable chart. Splitting the model into logical domains (e.g., “Billing,” “Inventory,” “User Management”) can improve clarity.
Final Thoughts on Modeling Integrity 📝
The value of a Data Flow Diagram lies in its ability to communicate complex system logic simply. When the diagram is plagued by pitfalls like Black Holes, Gray Holes, or unbalanced decompositions, it loses that value. It becomes a source of confusion rather than clarity.
By adhering to the principles of data conservation, maintaining strict naming conventions, and rigorously validating against the Data Dictionary, analysts can produce diagrams that serve as reliable blueprints for development. These diagrams bridge the gap between business requirements and technical implementation, ensuring that the final system functions exactly as intended. Committing to this level of detail in the analysis phase saves significant time and resources during the coding and testing phases.
Focus on accuracy over speed. A precise diagram built on sound logic is the most efficient tool a system analyst possesses. Avoid shortcuts that compromise the integrity of the model, and always prioritize the clarity of information flow above all else.