


Data Flow Diagrams (DFDs) are fundamental tools in systems analysis and design. They provide a visual representation of how data moves through a system, highlighting inputs, outputs, and storage points without detailing the specific logic or timing. For professionals entering the field of business analysis or software architecture, understanding how to construct a DFD is a critical skill. This guide walks you through the process of building a professional-grade diagram from the ground up, ensuring clarity and accuracy in your system modeling.
Whether you are mapping a simple inventory system or a complex enterprise resource planning module, the principles remain consistent. By following this structured approach, you ensure that your diagrams communicate effectively with stakeholders and developers alike.
Understanding the Core Components 🧩
Before drawing any lines or boxes, it is essential to understand the building blocks of a DFD. These symbols are standardized across the industry, though slight variations exist between notation styles. We will focus on the universal elements that appear in most diagrams.
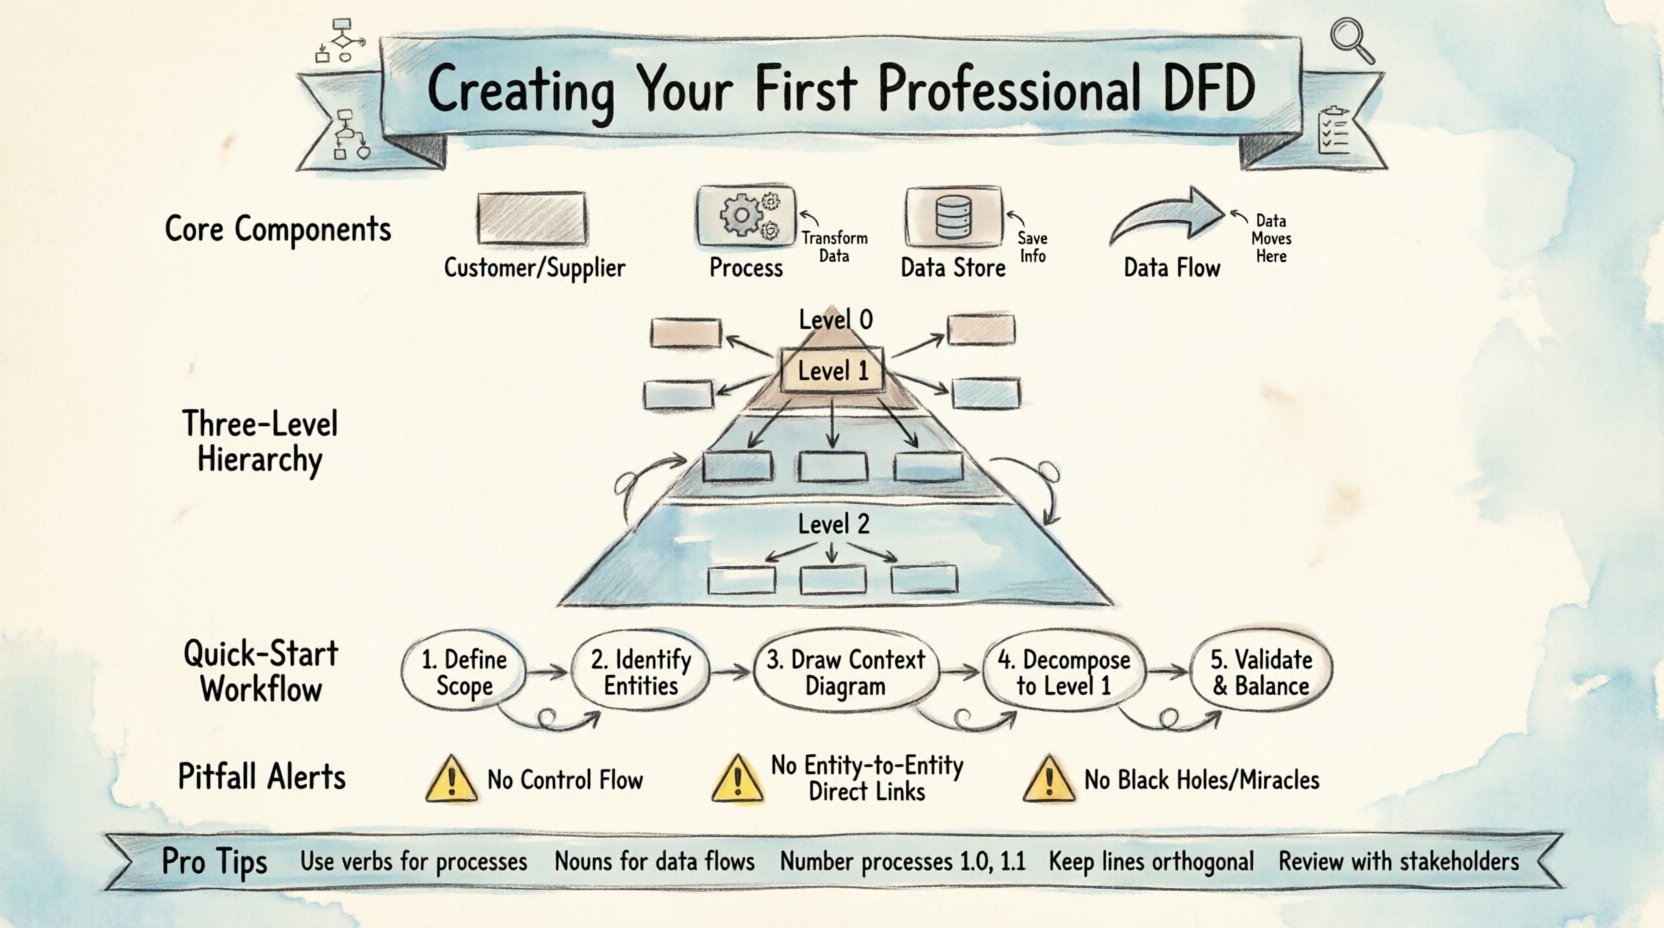
- External Entity: A person, organization, or external system that interacts with your system. They are the source or destination of data.
- Process: A specific action or transformation that changes data into something else. This represents work being done.
- Data Store: A place where data is held for later use. This could be a database, a file, or a physical filing cabinet.
- Data Flow: The movement of data between entities, processes, and stores. Arrows indicate the direction of this movement.
These components work together to create a narrative of information flow. To visualize the differences clearly, consider the following comparison table:
| Component | Symbol Shape | Function | Example |
|---|---|---|---|
| External Entity | Rectangle | Source or Sink | Customer, Supplier |
| Process | Circle or Rounded Rectangle | Transformation | Calculate Tax, Validate Order |
| Data Store | Open Rectangle | Persistence | Customer Database, Invoice Log |
| Data Flow | Arrow | Movement | Order Details, Payment Confirmation |
Choosing a Notation Style 🖊️
There are two primary notations used for DFDs. Understanding the distinction helps in selecting the right visual language for your team.
1. Yourdon and DeMarco Notation
Processes are represented as circles. Data stores are open-ended rectangles. This style is often considered more traditional and is widely used in legacy systems.
2. Gane and Sarson Notation
Processes are represented as rounded rectangles. Data stores are open rectangles with a thick vertical line. This style is generally preferred in modern software engineering contexts.
For this tutorial, we will use the Gane and Sarson style as it aligns well with modern UML and system design standards. However, the logical flow remains identical regardless of the visual style chosen.
Levels of Abstraction 🔍
A professional DFD is rarely a single page. It is a hierarchy of diagrams that zooms in and out of the system. This concept is known as Leveling or Balancing.
- Context Diagram (Level 0): This is the highest-level view. It shows the system as a single process and its interaction with external entities. It defines the boundaries of the system.
- Level 1 Diagram: This breaks the single process from the Context Diagram into major sub-processes. It provides more detail on how the system works internally.
- Level 2 Diagrams: These further decompose specific processes from Level 1 into granular steps. This is used for complex logic.
Starting with the Context Diagram is crucial. It sets the scope and prevents you from getting lost in details too early.
Preparation Phase 📝
Before opening any diagramming software, you must gather the necessary information. A DFD is not just about drawing; it is about understanding the business requirements.
1. Define the Scope
Clearly state what is inside the system and what is outside. If you are designing an Order Management System, does it include the shipping carrier? Usually, the carrier is an external entity. The system processes the order, but the carrier delivers the goods. Defining this boundary early avoids confusion later.
2. Identify External Entities
List every person, department, or system that sends data to or receives data from your system. Ask questions like:
- Who initiates the process?
- Who receives the final output?
- Are there any third-party APIs involved?
3. Gather Data Requirements
What data is being exchanged? You need to know the names of the data packets. For example, instead of just saying “data”, specify “Customer Invoice” or “Payment Authorization”. This specificity is vital for the Data Dictionary.
Step-by-Step Construction 🛠️
Now that you have the requirements, follow these steps to build the diagram.
Step 1: Draw the Context Diagram
- Place the Central Process: Draw a single circle or rounded rectangle in the center. Label it with the name of the system (e.g., “Online Store System”).
- Place External Entities: Draw rectangles around the edges of the page. Label them (e.g., “Customer”, “Payment Gateway”).
- Connect Data Flows: Draw arrows between the entities and the central process. Label each arrow with the data being passed.
- Verify Inputs and Outputs: Ensure every entity has a clear input or output. Do not leave entities floating without connections.
Step 2: Develop the Level 1 Diagram
Replace the single central process from the Context Diagram with a cluster of sub-processes. This is where the real work begins.
- Decompose the Process: Break the main system into 3 to 7 major functions. Too many functions suggest the process is not well-defined.
- Add Data Stores: Identify where information needs to be saved. Add open rectangles for these stores.
- Map the Flows: Draw arrows showing how data moves between the new sub-processes, entities, and stores.
- Maintain Balance: The inputs and outputs on the Level 1 diagram must match the Context Diagram exactly. If data enters the system in the Context Diagram, it must enter the Level 1 diagram.
Step 3: Refine with Level 2 Diagrams
If a specific sub-process from Level 1 is complex, break it down further. Repeat the same principles: inputs must match, and data stores must be consistent.
Validation and Balancing ✅
Creating the diagram is only half the battle. Validating it ensures logical consistency. This process is called Balancing.
Consistency Check: Compare the Context Diagram with the Level 1 Diagram. Every input and output data flow on the Context Diagram must appear on the Level 1 diagram. If you added a new input in Level 1 that wasn’t in Context, you have changed the system boundary without realizing it.
Conservation of Data: Every data store must have at least one data flow entering it and one leaving it. If a store only receives data, it is a “Black Hole”. If a store only sends data, it is a “Miracle”. Both are errors in modeling.
Common Pitfalls to Avoid ⚠️
Even experienced analysts make mistakes when first learning DFDs. Use the following checklist to catch errors early.
| Error Type | Description | Correction |
|---|---|---|
| Control Flow | Using DFD to show timing or logic (if/else). | DFDs show data, not control. Use flowcharts for logic. |
| Direct Entity-to-Entity Flow | Data passing between two external entities without a process. | Ensure all data passes through a process within the system boundary. |
| Process without Inputs | A process that creates data out of nothing. | Every process must transform existing input data. |
| Data Store Without Process | A store that no process connects to. | Ensure every store is accessed by at least one process. |
Another common issue is naming conventions. Labels should be verbs for processes (e.g., “Validate User”) and nouns for data flows (e.g., “Login Credentials”). Avoid vague terms like “Process 1” or “Data A”.
Data Dictionary Integration 📚
A professional DFD is often accompanied by a Data Dictionary. This document defines every data flow and data store in detail. It is not part of the visual diagram but is essential for completeness.
- Data Flow Definition: Name, description, source, destination, and format.
- Data Store Definition: Name, contents, and key attributes.
- Process Definition: Name, inputs, outputs, and logic description.
Linking your diagram to this dictionary ensures that developers know exactly what data is expected at each stage.
Best Practices for Professionalism 🌟
To ensure your diagrams are taken seriously by stakeholders, adhere to these standards.
- Keep it Clean: Avoid crossed lines. Use orthogonal lines (horizontal and vertical) instead of diagonal lines where possible. It improves readability.
- Numbering: Number your processes. Use 1.0 for Level 1 processes, 1.1 for sub-processes of 1.0, and so on. This helps in referencing specific parts of the diagram.
- Consistency: Use the same colors and shapes throughout the document. Do not mix notations.
- Review Cycles: Do not assume the first draft is correct. Review it with a subject matter expert. They might identify missing data flows you overlooked.
Documentation and Handoff 📤
Once the diagrams are validated, prepare the final documentation. This should include the diagrams themselves, the Data Dictionary, and a brief narrative explaining the scope.
When handing off to development teams, explain the conventions used. If you used specific symbols or naming rules, document them. This reduces the chance of misinterpretation during the coding phase.
Remember that a DFD is a living document. As the system evolves, the diagram should be updated. Treating it as static documentation leads to technical debt and confusion later in the project lifecycle.
Summary of Key Takeaways 🎯
- Start Simple: Begin with the Context Diagram to define boundaries.
- Focus on Data: DFDs map data movement, not control logic.
- Maintain Balance: Ensure inputs and outputs match across diagram levels.
- Avoid Errors: Watch out for Black Holes, Miracles, and Control Flows.
- Use Standards: Stick to consistent naming and notation styles.
By following these steps and adhering to these standards, you will create diagrams that serve as reliable blueprints for system development. The effort invested in creating a clear, accurate DFD pays off significantly during the implementation and testing phases. It acts as a communication bridge between business needs and technical execution.