


System architecture is not merely about code; it is about the movement of information. Data Flow Diagrams (DFDs) serve as the visual grammar for understanding how data enters a system, transforms, and exits. For software engineers, grasping these diagrams is fundamental to designing robust, scalable, and maintainable architectures. This guide explores the critical patterns and structural elements required to model complex systems effectively.
🔍 Understanding the Core Purpose
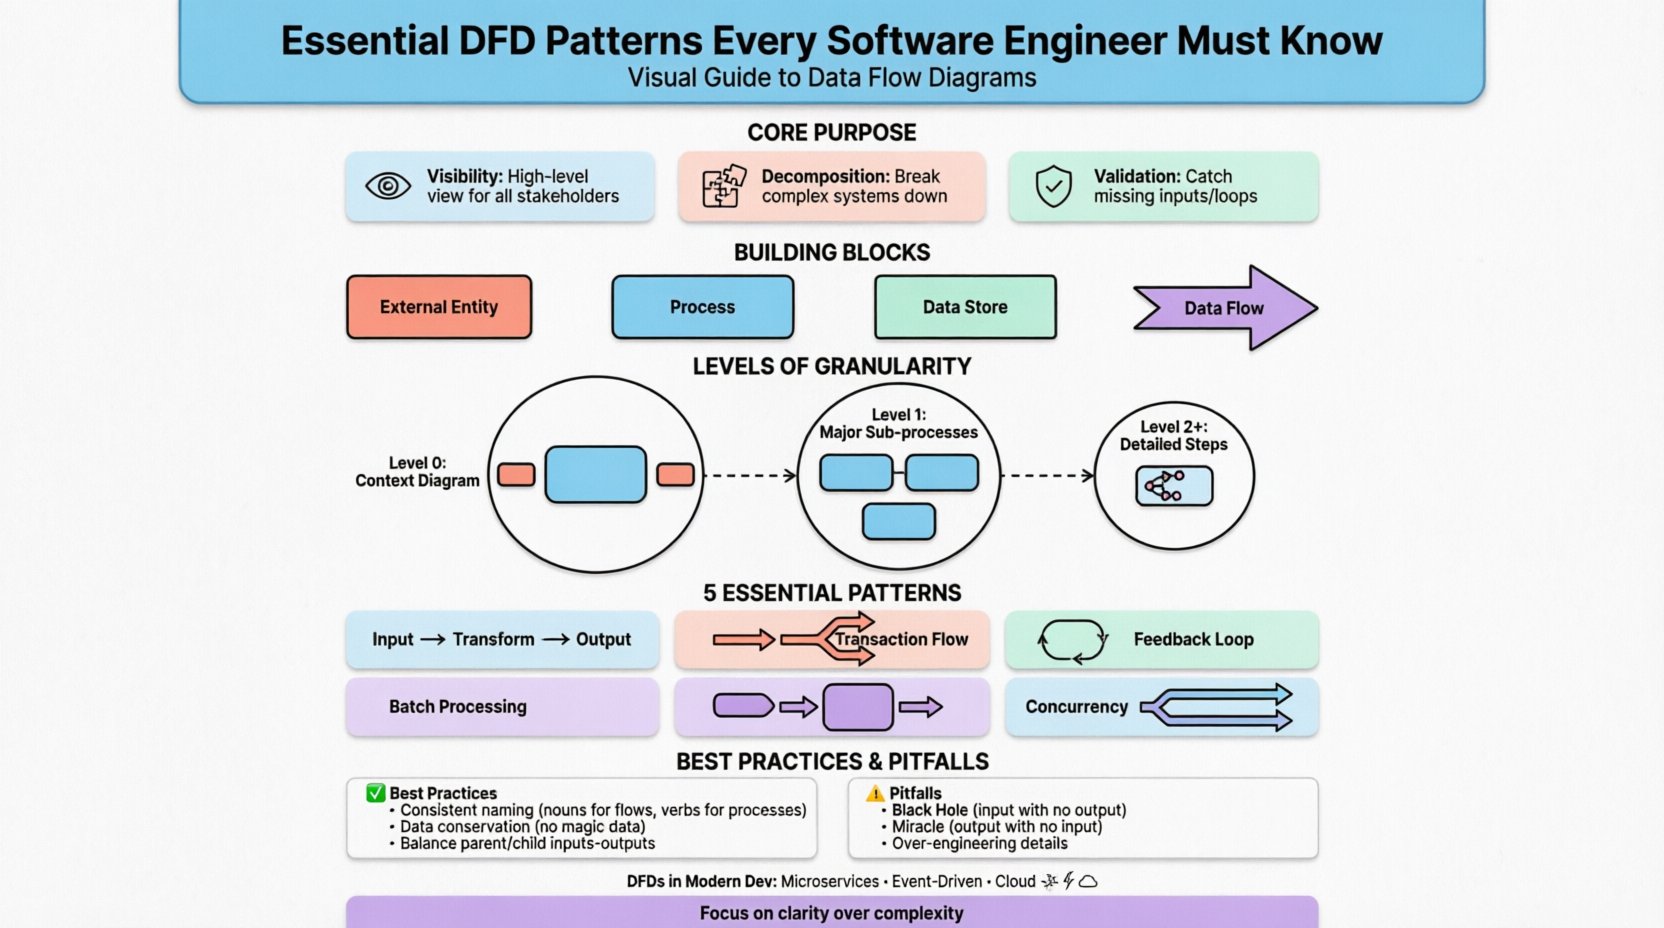
A Data Flow Diagram maps the flow of data between external entities and internal processes. Unlike flowcharts that focus on control flow (loops, conditions), DFDs focus on the data itself. This distinction is vital during the requirements gathering phase and subsequent design stages.
- Visibility: DFDs provide a high-level view that is accessible to both technical and non-technical stakeholders.
- Decomposition: They allow for breaking down complex systems into manageable sub-processes.
- Validation: They help identify missing inputs, orphaned outputs, or data loops that might cause logical errors.
🧱 The Building Blocks of a DFD
Before diving into patterns, one must understand the standard components. Every diagram relies on these four elements to convey information accurately.
| Component | Symbol Shape | Function |
|---|---|---|
| External Entity | Rectangle | Source or destination of data outside the system boundary (e.g., User, Payment Gateway). |
| Process | Circle or Rounded Rectangle | An action that transforms input data into output data (e.g., Calculate Tax). |
| Data Store | Open Rectangle | Passive storage where data rests between processes (e.g., Database, File System). |
| Data Flow | Arrow | The movement of data between the components above. |
Consistency in using these symbols is crucial. Mixing notation styles can lead to confusion and misinterpretation of the system logic.
📉 Levels of Granularity
DFDs are rarely created as a single image. Instead, they follow a hierarchy known as leveling or decomposition. This approach prevents cognitive overload by separating concerns.
1. Context Diagram (Level 0)
This is the highest level of abstraction. It represents the entire system as a single process. The primary goal is to define the system boundary.
- Identifies all external entities interacting with the system.
- Shows major data flows entering and leaving the system.
- Does not show internal processes or data stores.
2. Level 1 Diagram
The single process from the Context Diagram is exploded into the major sub-processes. This is where the system’s core functionality begins to take shape.
- Breaks the system into 3 to 7 main functions.
- Introduces internal data stores.
- Refines data flows between the main functions.
3. Level 2 and Beyond
Specific processes from Level 1 are further decomposed into detailed steps. This level is used for complex logic that requires precise specification.
- Used for detailed design documentation.
- Ensures every data transformation is accounted for.
- Can extend to Level 3 or 4 depending on system complexity.
🔄 Essential Architectural Patterns in DFDs
Beyond basic structure, specific patterns emerge in how data moves through a system. Recognizing these patterns helps engineers anticipate bottlenecks and design better error handling.
1. Transform Flow Pattern
This is the most common pattern, where data enters, undergoes a series of transformations, and exits. It follows a linear progression: Input -> Transform -> Output.
- Characteristics: Sequential processing steps.
- Use Case: Report generation, data validation pipelines, order processing.
- Consideration: Ensure intermediate data stores are minimized to maintain speed.
2. Transaction Flow Pattern
Here, a single input triggers one of several possible paths based on a condition. The system acts as a dispatcher.
- Characteristics: Decision points direct data down specific branches.
- Use Case: Order routing (Shipping vs. Digital Download), error handling branches.
- Consideration: Avoid deep nesting of conditions which makes the diagram hard to read.
3. Feedback Loop Pattern
Data flows from an output back into an input or process, creating a cycle. This is common in systems requiring adjustment or learning.
- Characteristics: Circular data movement.
- Use Case: Inventory replenishment, iterative design processes, thermostat control.
- Consideration: Clearly mark where the loop starts and stops to prevent infinite processing scenarios.
4. Batch Processing Pattern
Instead of real-time interaction, data is accumulated over a period and processed together.
- Characteristics: Data flows into a store, waits, then flows out.
- Use Case: End-of-day reconciliation, nightly backups, log aggregation.
- Consideration: Define the trigger mechanism for the batch clearly.
5. Concurrency and Parallelism
Multiple processes operate simultaneously on the same data or related data streams.
- Characteristics: Splitting a flow into multiple parallel arrows that merge later.
- Use Case: Multi-threaded applications, distributed microservices, simultaneous API calls.
- Consideration: Watch for race conditions where data consistency is at risk.
🛠 Best Practices for Modeling
Creating a diagram is easy; creating a useful one requires discipline. Adhering to specific rules ensures the model remains accurate and maintainable.
- Consistent Naming: Use nouns for data flows (e.g., “User ID”) and verbs for processes (e.g., “Verify ID”).
- Data Conservation: Every output must be derived from an input. Data cannot appear out of nowhere.
- Balancing: The inputs and outputs of a parent process must match the inputs and outputs of its child process.
- Minimize Crossings: Arrange components to reduce the number of lines crossing each other. This improves readability.
- Limit Fan-Out: A single process should not feed too many other processes directly unless necessary for clarity.
⚠️ Common Pitfalls to Avoid
Even experienced engineers make mistakes when modeling. Being aware of these common errors can save significant rework later.
1. The Black Hole
A process has inputs but no outputs. This implies data is consumed without producing a result, which is usually a logical error.
2. The Miracle
A process has outputs but no inputs. This suggests data is generated magically, which violates system logic.
3. Data Store Confusion
Using data stores for temporary holding within a single transaction versus permanent storage. Distinguish between volatile memory and persistent storage in your notation.
4. Over-Engineering
Attempting to model every single variable or micro-transaction. DFDs are for system-level logic, not implementation-level details like variable types or database column names.
5. Ignoring Error Flows
Most diagrams show the “Happy Path.” A robust model must include error flows, such as invalid authentication or failed network requests.
🌐 DFDs in Modern Development
While often associated with Waterfall methodologies, DFDs remain relevant in Agile and DevOps environments. They serve as a communication bridge between product managers and engineers.
- Microservices: DFDs help map service boundaries and API contracts. Each service can be a node in the diagram.
- Event-Driven Architecture: Flows are triggered by events rather than direct calls. The diagram must reflect event streams.
- Cloud Infrastructure: Data stores often represent cloud buckets or managed databases. External entities may include third-party SaaS platforms.
📋 Comparison of Notation Styles
Different methodologies use slightly different symbols. Understanding the differences ensures you can read documentation from various sources.
| Feature | Yourdon & DeMarco | Gane & Sarson |
|---|---|---|
| Process | Rounded Rectangle | Circle |
| External Entity | Rectangle | Rectangle |
| Data Store | Open Rectangle | Open Rectangle with vertical line |
| Data Flow | Arrow | Arrow |
Both styles are valid. The key is to choose one standard for a project and stick to it to maintain consistency across the documentation.
📝 Integrating with Data Dictionaries
A DFD is only as good as the definitions attached to it. A Data Dictionary complements the diagram by defining the structure of every data flow and store.
- Metadata: Includes data type, size, and format.
- Constraints: Defines rules like “Must be numeric” or “Cannot be null”.
- Relationships: Links data elements to the specific processes that create or modify them.
Without this detail, the DFD remains a high-level sketch. With it, the DFD becomes a specification that developers can reference during coding.
🧩 Handling Complex Logic
Sometimes, a system is too complex for a single diagram. In these cases, use reference markers.
- External Reference: Indicates that a process is defined in another diagram.
- Internal Reference: Indicates a sub-process that is detailed in a child diagram.
This modular approach allows you to keep the high-level view clean while providing deep details where needed. It prevents the “spaghetti diagram” problem where lines cross chaotically.
🔒 Security Considerations in DFDs
Security is often an afterthought in modeling. However, data flows represent potential attack vectors. A DFD should explicitly mark sensitive data.
- Encryption: Mark flows containing Personally Identifiable Information (PII) as encrypted.
- Authentication: Indicate where user verification is required before data flows proceed.
- Access Control: Note which processes have read vs. write access to specific data stores.
This visual cue helps security auditors quickly identify where sensitive data resides and moves.
🚀 Maintenance and Updates
Software evolves, and diagrams must evolve with it. A static DFD becomes technical debt. Establish a protocol for updates.
- Version Control: Treat diagrams like code. Commit changes with descriptive messages.
- Review Cycles: Include diagram updates in the definition of done for major features.
- Legacy Systems: Document current states before refactoring to ensure nothing is lost during migration.
🎯 Final Thoughts
Data Flow Diagrams are a timeless tool for system analysis. They force engineers to think about data, not just code. By mastering the core components, understanding the levels of decomposition, and recognizing the underlying architectural patterns, you can design systems that are clear, efficient, and easier to maintain.
Focus on clarity over complexity. A diagram that is understood by the team is more valuable than one that is technically perfect but confusing. Use these patterns to build a foundation for robust software architecture, ensuring that every piece of data has a known origin and a known destination.