


In the complex landscape of business systems, information is the lifeblood that keeps operations running smoothly. However, without a clear map, data can become a tangled web that confuses stakeholders and hinders progress. This is where the Data Flow Diagram (DFD) proves its worth. It serves as a visual representation of how information moves through a system, highlighting inputs, outputs, and storage points. For business analysts, creating these diagrams is not just about drawing lines; it is about structuring thought and ensuring every piece of data has a purpose and a path.
When organizations face messy requirements or unclear processes, the clarity provided by a well-constructed DFD brings order. It allows teams to see the big picture before diving into code or configuration. This guide explores the essential mechanics of creating these diagrams, the rules that govern their construction, and the strategic value they add to the business analysis lifecycle.
Understanding the Core Purpose of Data Flow Diagrams 🧩
A Data Flow Diagram is a graphical representation of the flow of data through an information system. Unlike flowcharts, which focus on logic and decision points, DFDs focus strictly on data movement. They answer the question: What happens to the data? rather than How does the decision happen?
The primary goal is to visualize the system from a functional perspective. It strips away technical implementation details to focus on the business logic. This abstraction allows stakeholders who are not technical experts to understand the system’s behavior. By breaking down complex systems into manageable chunks, analysts can identify gaps, redundancies, and inefficiencies early in the project.
Key objectives include:
- Communication: Providing a shared language between business stakeholders and technical teams.
- Analysis: Identifying bottlenecks where data accumulates or stalls.
- Documentation: Creating a reference point for future maintenance and upgrades.
- Validation: Ensuring all requirements are accounted for in the system design.
The Fundamental Building Blocks 🏗️
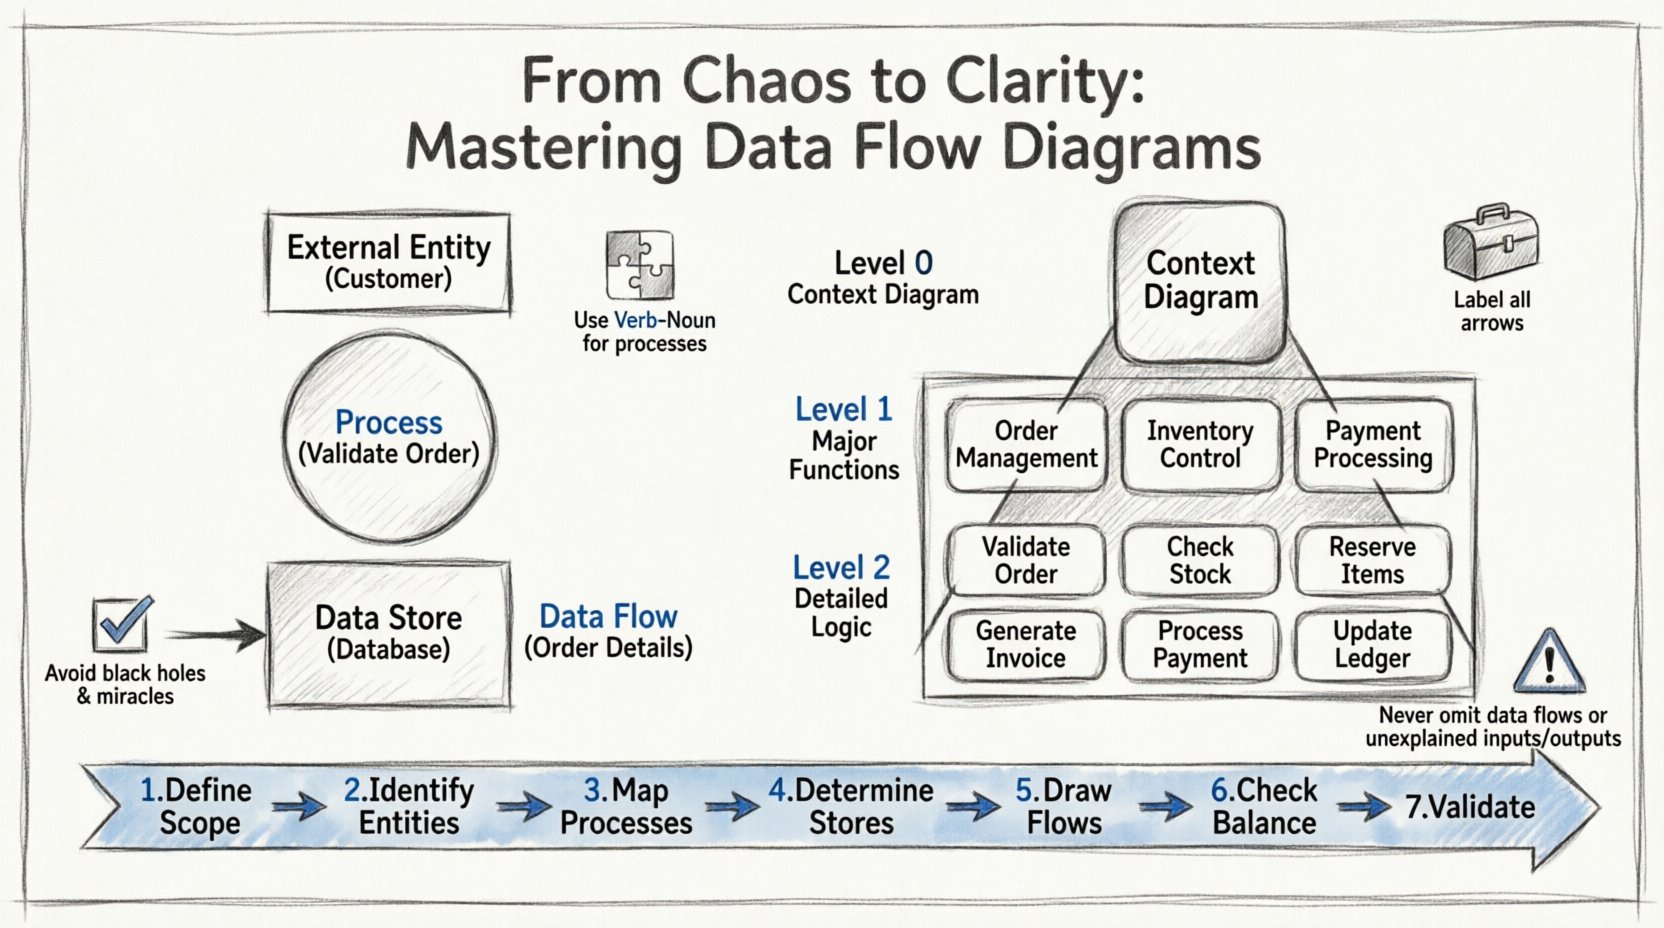
To construct a valid diagram, one must understand the standard symbols used in this notation. While variations exist, the most common standards rely on four distinct components. Each component plays a specific role in defining the system’s architecture.
1. External Entities
These are sources or destinations of data that exist outside the boundary of the system being analyzed. They are often represented by rectangles. An external entity provides data to the system or receives data from it. Common examples include customers, suppliers, regulatory bodies, or other external systems.
- They do not process data within the context of this specific system.
- They represent the boundaries of the current scope.
- They can be people, departments, or other organizations.
2. Processes
Processes transform data. They take input, apply logic or rules, and produce output. In a DFD, these are usually depicted as circles or rounded rectangles. A process is the active part of the system where work is actually done.
- Every process must have at least one input and one output.
- Processes should be named using a Verb-Noun phrase (e.g., Validate Order).
- They represent the functional requirements of the system.
3. Data Stores
These are places where data is held for later use. They are typically represented by open-ended rectangles or parallel lines. Unlike processes, data stores do not change the data; they simply retain it.
- Common examples include databases, file systems, or even physical filing cabinets.
- Data must flow into a store to be saved and flow out to be retrieved.
- They represent the persistence layer of the application.
4. Data Flows
Data flows represent the movement of information between entities, processes, and stores. They are depicted as arrows. The direction of the arrow indicates the path the data takes.
- Every flow must be labeled with a noun phrase describing the data (e.g., Invoice Details).
- They indicate the requirements for data transmission.
- They help trace the lineage of information throughout the system.
| Component | Visual Shape | Function | Example |
|---|---|---|---|
| External Entity | Rectangle | Source or Destination | Customer, Vendor |
| Process | Circle / Rounded Rect | Transformation of Data | Calculate Tax, Update Record |
| Data Store | Open Rectangle | Storage of Data | Database, File Repository |
| Data Flow | Arrow | Movement of Data | Order Request, Payment Info |
Levels of Decomposition: Breaking Down Complexity 📉
Complex systems cannot be understood in a single view. To manage this complexity, DFDs are created at different levels of detail. This technique is known as decomposition. It allows the analyst to zoom in on specific areas without overwhelming the viewer with too much information at once.
Level 0: The Context Diagram
The Context Diagram is the highest level view. It shows the entire system as a single process and its interaction with external entities. It defines the boundary of the system clearly.
- Scope: Macro level.
- Detail: Minimal.
- Usage: To establish the perimeter of the project.
Level 1: The Main Decomposition
Level 1 expands the single process from the context diagram into its major sub-processes. This level identifies the main functional areas of the system. It provides a good balance between high-level overview and specific functionality.
- Scope: Major functional groups.
- Detail: Moderate.
- Usage: To define major modules or workstreams.
Level 2: Detailed Processes
Level 2 takes a specific process from Level 1 and breaks it down further. This is where the granular logic is captured. It is often used for specific modules that require detailed specification.
- Scope: Specific sub-functions.
- Detail: High.
- Usage: For development teams to understand specific logic.
| Level | Focus | Number of Processes | Best Used For |
|---|---|---|---|
| Context (Level 0) | System Boundary | 1 | Stakeholder Alignment |
| Level 1 | Major Functions | 3-7 | Architecture Planning |
| Level 2 | Specific Logic | Variable | Functional Specification |
Step-by-Step Guide to Creating a DFD 🛠️
Creating a robust diagram requires a methodical approach. Skipping steps often leads to inconsistencies that cause confusion later. Follow this structured workflow to ensure accuracy.
- Define the Scope: Clearly identify what is inside the system and what is outside. Determine the primary goal of the analysis.
- Identify External Entities: List all people, systems, or departments that interact with the system. Do not forget hidden stakeholders.
- Map Major Processes: Brainstorm the key activities the system performs. Group related activities together for the Level 1 diagram.
- Determine Data Stores: Decide where data needs to be saved. Identify what information is read from or written to storage.
- Draw Data Flows: Connect the entities, processes, and stores using arrows. Ensure every line has a label.
- Check for Balance: Ensure inputs and outputs match between levels. If a process is split, the total input must equal the total output.
- Review and Validate: Walk through the diagram with stakeholders to verify it matches their mental model of the process.
Best Practices for Consistency and Clarity ✅
To maintain high quality, adhere to established conventions. Deviations can make diagrams harder to read and interpret. Consistency is key to effective documentation.
1. Naming Conventions
- Processes: Always use a verb followed by a noun (e.g., Generate Report, not Report Generation). This emphasizes action.
- Data Flows: Use nouns to describe the content (e.g., Shipping Address, not Shipping). This emphasizes the data itself.
- Entities: Use plural nouns to represent the group (e.g., Employees, Customers).
- Stores: Use plural nouns to indicate collections of records (e.g., Inventory Files).
2. Avoid Control Flow
DFDs are not control flow diagrams. Do not use arrows to show timing, sequencing, or conditions. Arrows must only represent data. If a condition exists, it belongs in the process description, not on the arrow.
3. Numbering System
Use a consistent numbering scheme to link diagrams together. For example, if Process 1.0 is split, the sub-processes might be 1.1, 1.2, and 1.3. This makes referencing specific areas easy in documentation.
4. Balancing Rule
This is the most critical rule. The inputs and outputs of a parent process must match the inputs and outputs of its child processes. If data flows into a Level 1 process, it must also flow into at least one Level 2 sub-process. If a store is added in a lower level, it must be accounted for in the higher level data flow.
Common Pitfalls to Avoid 🚫
Even experienced analysts make mistakes. Being aware of common errors helps in refining the diagram before it is finalized.
- Black Holes: A process that has inputs but no outputs. This implies data disappears, which is usually incorrect.
- Miracles: A process that has outputs but no inputs. This implies data is created from nothing, which violates data integrity.
- Data Store as Process: Never use a rectangle with rounded corners for a store. Confusing storage with transformation leads to logic errors.
- Direct Entity-to-Entity Flow: Data should rarely move directly between external entities without passing through the system. If it does, consider if it bypasses the scope.
- Too Many Flows: If a process has more than five or six inputs and outputs, it is likely too complex. Decompose it further.
- Ignoring Feedback Loops: Systems often involve updates. Ensure that changes to data stores are reflected in subsequent flows.
Integrating DFDs with Other Business Artifacts 🔗
A DFD does not exist in isolation. It works best when integrated with other documentation tools used in business analysis.
Relationship with User Stories
User stories describe functionality from a user perspective. The DFD provides the backend structure that supports those stories. For example, a story about Placing an Order maps to a process in the DFD that handles order entry and validation.
Relationship with Data Dictionaries
A data dictionary defines the attributes of every data element. The DFD uses the names from the dictionary to label flows. This ensures that Customer ID in the diagram matches the Customer_ID field in the database schema.
Relationship with Use Cases
Use cases describe interactions between actors and the system. DFDs describe the movement of data resulting from those interactions. Together, they provide a complete picture of system behavior and data integrity.
Maintaining Diagrams Over Time 🔄
Systems evolve. Requirements change. A diagram created today may be obsolete tomorrow. Maintenance is a critical part of the lifecycle.
- Version Control: Keep track of changes. If a process is updated, note the version number.
- Change Management: When a requirement changes, review the diagram immediately to see the impact.
- Regular Audits: Periodically review the diagrams against the actual system to ensure they match reality.
- Communication: Share updates with all stakeholders so everyone is working from the same source of truth.
Strategic Value for Business Analysts 💡
The investment in creating detailed diagrams pays off during the development and testing phases. When developers understand the data flow, they write cleaner code. When testers understand the flow, they create better test cases. For the business analyst, it reduces the risk of misinterpretation.
It also aids in gap analysis. By mapping the current state (As-Is) and the future state (To-Be), the analyst can clearly see what needs to change. This visual comparison is often more powerful than pages of text. It highlights missing steps, redundant loops, or unauthorized data access points.
Final Thoughts on Process Modeling 🎯
Building a clear map of data movement is a fundamental skill for any business analyst. It transforms abstract requirements into concrete visual models. By adhering to the rules of decomposition, maintaining strict naming conventions, and ensuring logical balance, analysts can create diagrams that serve as reliable blueprints for system development.
The journey from chaos to clarity requires discipline. It is not enough to simply draw lines; one must understand the logic behind the movement of information. When done correctly, the Data Flow Diagram becomes an indispensable tool for bridging the gap between business needs and technical solutions.