


Data Flow Diagrams (DFDs) have long served as the backbone of system analysis and design. Traditionally, these diagrams were static representations, often created on paper or isolated within rigid software environments. While they provided a snapshot of data movement, they frequently struggled to keep pace with the dynamic nature of modern development cycles. Today, the shift towards interactive DFDs represents a fundamental change in how teams visualize, document, and refine complex systems.
By integrating digital tools that support real-time collaboration, organizations can transform their modeling processes from solitary tasks into shared, living artifacts. This guide explores the mechanics, benefits, and implementation strategies of interactive Data Flow Diagramming. We will examine how to enhance communication, reduce errors, and maintain clarity across cross-functional teams without relying on static documentation.
🔄 The Evolution from Static to Interactive Modeling
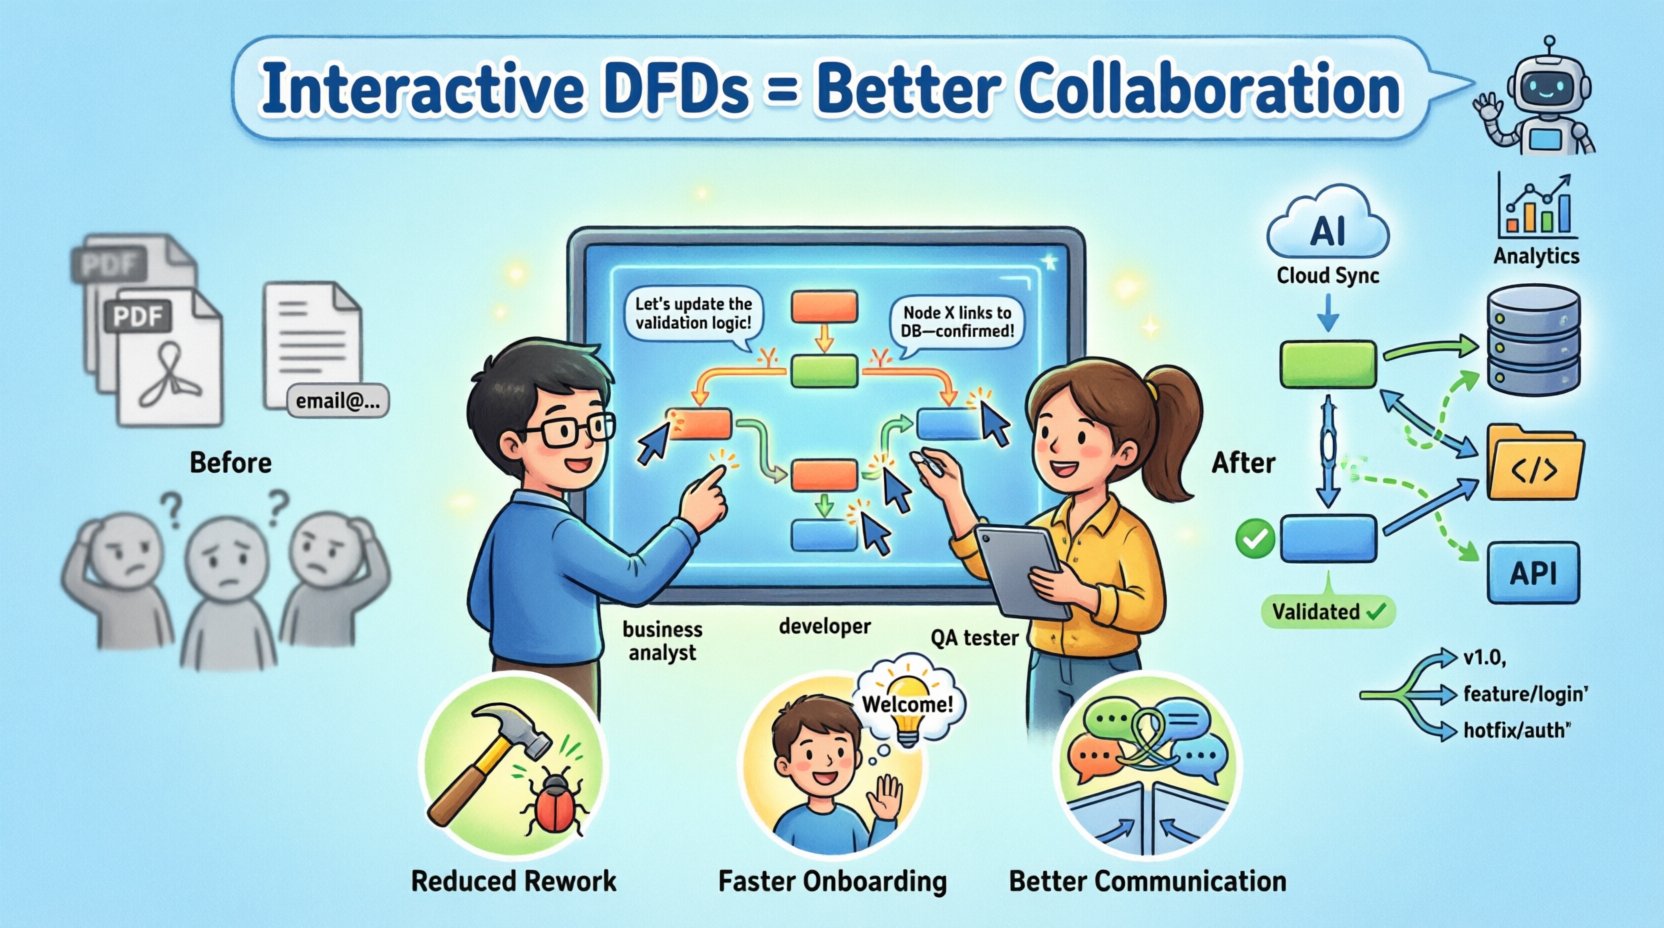
Understanding the current landscape requires looking at how modeling has changed over time. The traditional approach involved creating a diagram, saving it as an image or PDF, and distributing it to stakeholders. This method introduced several friction points:
- Version Confusion: Multiple copies of the same diagram circulated, leading to ambiguity about which version was the source of truth.
- Lag in Updates: Changes in requirements often went undocumented in the visual model for days or weeks.
- Isolation: Only the primary analyst could edit the diagram, creating a bottleneck for feedback.
- Context Loss: Static images lack the metadata and logic links found in dynamic files.
Interactive platforms address these issues by treating the diagram as a database rather than a picture. Every shape, arrow, and label holds data that can be queried, linked, and updated in real time. This shift enables a continuous feedback loop between business stakeholders and technical teams.
🛠️ Core Capabilities of Modern Modeling Tools
To leverage these tools effectively, it is essential to understand the specific functionalities that distinguish interactive systems from their predecessors. These capabilities form the foundation of effective collaboration.
1. Real-Time Co-Editing
Multiple users can work on the same diagram simultaneously. This feature allows a business analyst to define a process while a developer simultaneously maps the technical implementation. Changes appear instantly, reducing the need for meetings to review drafts.
2. Bi-Directional Linking
Interactive tools allow connections between the diagram and external data sources. A process node can link directly to a database schema, a user story, or a code repository. This ensures that the visual model remains synchronized with the actual system components.
3. Automated Validation
Rules can be set to check for common errors. For instance, the system might flag a data store that has no incoming flow or a process that has no output. This automated governance reduces the cognitive load on reviewers and ensures consistency.
4. Version Control Integration
Just as code is managed in repositories, model changes should be tracked. Modern systems integrate with version control protocols, allowing teams to revert changes, compare revisions, and tag specific releases.
🤝 Enhancing Collaboration Dynamics
The primary value of interactive DFDs lies in how they change human interaction. When documentation is static, it is often treated as a final deliverable. When it is interactive, it becomes a conversation starter.
Breaking Down Silos
Development, Operations, and Business units often speak different languages. A DFD acts as a universal translator. When the diagram is hosted on a shared platform:
- Business Users can see how their requirements translate into data processes without needing technical jargon.
- Developers can see the scope of data handling and storage requirements clearly.
- QA Teams can trace test cases directly back to specific nodes in the diagram.
Feedback Loops
Interactive tools often include annotation features. Instead of leaving comments in an email thread, users can comment directly on a specific process node. This contextual feedback ensures that discussions remain tied to the specific element being reviewed.
| Traditional Approach | Interactive Approach |
|---|---|
| Email attachments for reviews | In-line comments and annotations |
| Weekly status meetings | Live dashboard updates |
| Manual consistency checks | Automated validation rules |
| Static PDF deliverables | Live, queryable data model |
🧩 Implementation Strategies
Moving to an interactive modeling environment requires a structured approach. Simply purchasing a tool does not guarantee better collaboration. The process must be adapted to fit the new capabilities.
1. Define the Scope
Start by identifying which systems require detailed modeling. Not every subsystem needs a full interactive DFD. Focus on critical paths where data flow complexity is high and stakeholder confusion is frequent.
2. Establish Standards
Consistency is key to readability. Teams should agree on:
- Naming Conventions: Processes should be verb-noun phrases (e.g., “Calculate Invoice”).
- Symbol Usage: Define what specific shapes represent (e.g., rectangles for processes, open-ended rectangles for data stores).
- Level of Detail: Determine when to break down a process into a lower-level diagram.
3. Permission Management
Collaboration tools allow for granular access control. Not every stakeholder needs to edit every part of the system. Roles should be assigned based on responsibility:
- Viewers: Can see the diagram and add comments but cannot change the model.
- Editors: Can modify nodes and flows but cannot delete the entire structure.
- Admins: Have full control over layout, settings, and user permissions.
📉 Measuring Success and ROI
Organizations need to know if the investment in interactive modeling yields results. Success can be measured through specific indicators related to efficiency and quality.
Reduction in Rework
One of the primary metrics is the number of changes required after the design phase. Interactive diagrams catch logical errors early. When a flow is impossible to implement, it should be visible before code is written.
Time to Onboarding
New team members should understand the system faster. A living diagram serves as up-to-date documentation. If a developer can navigate the data flow without asking questions, the documentation is effective.
Stakeholder Engagement
Measure how often stakeholders interact with the model. High engagement rates indicate that the visualization is accessible and relevant to their work.
⚠️ Common Challenges and Mitigation
Adopting new methodologies often introduces friction. Recognizing these challenges early allows teams to navigate them smoothly.
Complexity Creep
There is a tendency to add too much detail to an interactive diagram. Because editing is easy, users may clutter the view with unnecessary information. Mitigation: Enforce strict rules on diagram levels. Keep high-level views separate from detailed implementation views.
Tool Dependency
Teams may become dependent on a specific platform. If the tool changes or is discontinued, the data must be portable. Mitigation: Ensure the tool supports standard export formats and data portability clauses.
Resistance to Change
Some team members may prefer the familiarity of static tools. Mitigation: Provide training that highlights time savings. Show concrete examples of how the new method reduces meeting time.
🔗 Integration with Development Workflows
Interactive DFDs should not exist in a vacuum. They must integrate with the broader software development lifecycle (SDLC).
Connecting to Issue Trackers
Tasks derived from the diagram should link to issue tracking systems. When a process is identified as needing optimization, a ticket can be generated directly from the diagram node.
API and Data Dictionary Sync
Data stores in the DFD should ideally sync with the actual database schema. This ensures that field names and types match between the design and the implementation. This synchronization reduces the risk of data mapping errors during development.
🔮 Future Trends in System Modeling
The field of system design continues to evolve. Several trends are shaping the future of interactive DFDs.
- AI-Assisted Modeling: Algorithms may suggest optimizations or flag missing flows based on historical data.
- Code Generation: Some platforms are moving towards generating boilerplate code directly from the diagram structure.
- Cloud-Native Architecture: Diagrams are becoming cloud-hosted services, accessible from anywhere without local installation.
- Visual Analytics: Integrating performance metrics directly into the diagram, showing load times or error rates on specific nodes.
📝 Best Practices for Maintenance
A diagram is only as good as its accuracy. Regular maintenance is required to keep the model useful.
- Scheduled Reviews: Set a recurring time to review the diagram against the current system state.
- Change Logs: Maintain a history of major updates within the tool.
- Archive Old Versions: Keep older versions accessible for auditing purposes, even if they are no longer active.
- Single Source of Truth: Ensure the digital tool is the only place where the diagram is edited. Avoid local copies.
🎯 Summary of Key Takeaways
Adopting interactive Data Flow Diagrams is more than a technical upgrade; it is a cultural shift towards transparency and shared understanding. By utilizing digital tools that support real-time collaboration, teams can reduce errors, speed up development, and ensure that documentation remains relevant.
The transition requires clear standards, defined roles, and a commitment to maintenance. However, the long-term benefits in communication efficiency and system reliability make the effort worthwhile. As systems become more complex, the ability to visualize and discuss data flows in real-time becomes an essential competency for any technical organization.
❓ Frequently Asked Questions
Q: Do I need to learn a new programming language to use these tools?
A: No. These platforms are designed to be visual. They operate through drag-and-drop interfaces and configuration menus rather than code.
Q: Can these tools replace documentation entirely?
A: While they serve as a central documentation hub, they should be part of a broader documentation strategy. Textual explanations and API references still hold value alongside visual models.
Q: How do I handle sensitive data in a cloud-hosted diagram?
A: Ensure the tool complies with your organization’s security policies. Many platforms offer role-based access control and encryption for data at rest and in transit.
Q: Is this suitable for agile teams?
A: Yes. Interactive DFDs align well with agile methodologies because they can be updated sprint-by-sprint, reflecting the current state of the product rather than a frozen design.