


Designing complex software architectures requires more than just writing code. It demands a clear visualization of how components interact. Among the Unified Modeling Language (UML) specifications, the Communication Diagram offers a unique perspective on system behavior. This guide explores how to leverage these diagrams to map out distributed system logic effectively.
When building distributed systems, data flows across multiple nodes. Understanding the path of that data is critical for maintaining stability. A Communication Diagram provides a spatial view of these interactions, focusing on the relationships between objects rather than the strict timeline found in other models.
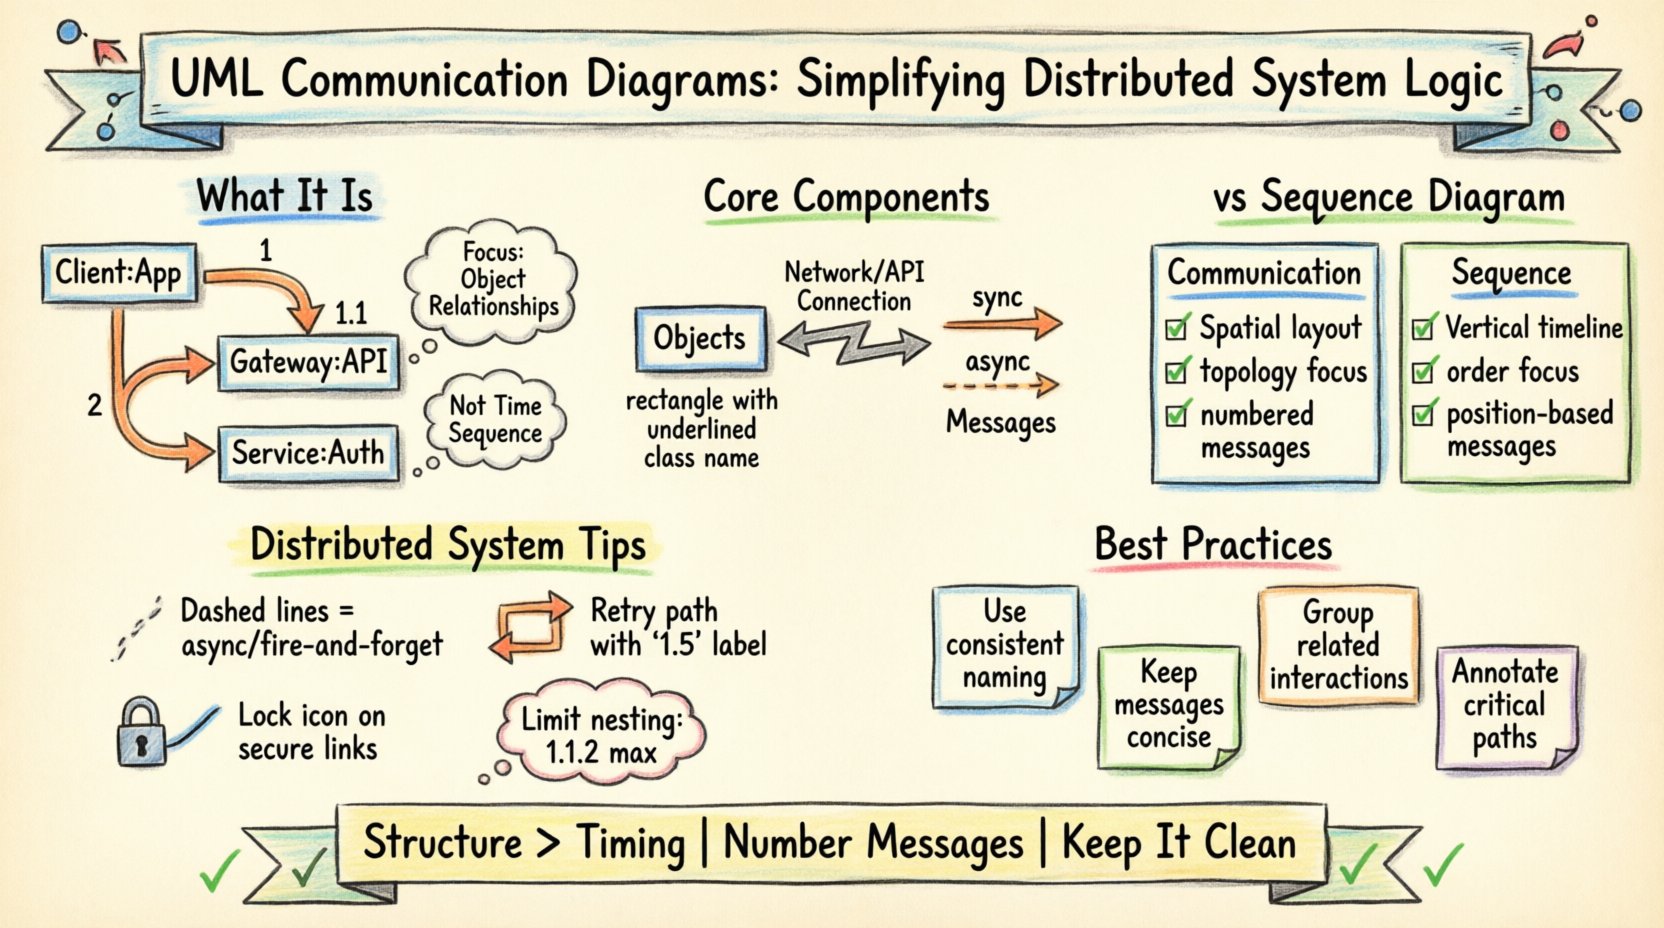
🧩 What Is a UML Communication Diagram?
A Communication Diagram is a behavioral diagram within the UML 2.x standard. It illustrates how objects interact with one another to achieve a specific goal. Unlike a Sequence Diagram, which emphasizes time and order, a Communication Diagram emphasizes the structural links between objects.
- Focus: It highlights the topology of the system.
- Usage: It is ideal for showing complex object structures.
- Output: It helps developers understand the connections required for data transmission.
In a distributed environment, services often rely on remote procedure calls or message queues. Mapping these connections visually allows architects to identify bottlenecks before implementation begins.
🔍 Core Components and Notation
To create a valid diagram, one must understand the standard notation. These elements form the vocabulary of the diagram.
1. Objects and Instances
Objects represent instances of classes within the system. They are drawn as rectangles with the class name underlined. In a distributed context, an object might represent a specific service instance or a database connection.
- Labeling: Use the format objectName : ClassName.
- Multiplicity: Indicate how many instances might exist, such as 1..* for one or more.
2. Links
Links represent the physical or logical connections between objects. In a distributed system, a link might signify a network connection, an API endpoint, or a shared memory space.
- Direction: Links are bidirectional unless specified otherwise.
- Navigation: They show which objects can access which other objects directly.
3. Messages
Messages are the arrows that traverse the links. They represent the flow of information or control.
- Synchronous: The sender waits for a response. Represented by a solid line.
- Asynchronous: The sender continues without waiting. Represented by a dashed line.
- Return: The response to a message. Often shown with a dashed line and an open arrowhead.
Each message must be numbered to indicate the order of execution. For example, 1, 1.1, 1.2, 2, etc.
📋 Communication Diagram vs. Sequence Diagram
Confusion often arises between Communication Diagrams and Sequence Diagrams. Both depict interactions, but they serve different analytical purposes. The table below clarifies the distinctions.
| Feature | Communication Diagram | Sequence Diagram |
|---|---|---|
| Primary Focus | Object relationships and topology | Time sequence and order of events |
| Visual Layout | Spacial arrangement of objects | Vertical timeline with lifelines |
| Complexity | Best for complex structural links | Best for long, linear process flows |
| Message Order | Indicated by numbering | Indicated by vertical position |
| Use Case | High-level architecture overview | Detailed algorithmic logic |
🛠️ Step-by-Step Guide to Creating a Diagram
Creating a robust diagram requires a methodical approach. Follow these steps to ensure accuracy and clarity.
Step 1: Identify the Scenario
Define the specific use case you are modeling. For a distributed system, this might be “User Login” or “Data Synchronization.” Keep the scope narrow enough to be clear but broad enough to cover necessary interactions.
Step 2: List the Objects
Identify every component involved in this scenario. In a microservices architecture, these could include:
- Client Application
- API Gateway
- Authentication Service
- Database Server
- Logging Service
Step 3: Draw the Links
Connect the objects based on their direct dependencies. If the Client talks to the API, draw a link. If the API talks to the Database, draw a link. Do not draw links between objects that do not communicate directly, even if they are part of the same system.
Step 4: Add Messages
Draw arrows along the links to show the flow. Assign numbers to these arrows. Start with the primary request (1), then follow up with sub-requests (1.1, 1.2). This numbering is crucial for understanding the execution path.
Step 5: Annotate and Refine
Add notes to explain complex logic. Mention constraints, such as timeout limits or security protocols. Review the diagram to ensure no object is isolated unless intended.
🌐 Applying to Distributed System Logic
Distributed systems introduce unique challenges, such as network latency, partial failures, and consistency models. Communication diagrams help address these by visualizing the dependencies.
Handling Asynchronous Communication
In modern architectures, services often decouple using message brokers. A communication diagram can show this by:
- Using dashed lines for fire-and-forget messages.
- Labeling messages with event names (e.g., OrderCreated).
- Showing that the sender does not wait for the receiver to acknowledge.
Visualizing Failures and Retries
Robust systems must handle errors. You can model this in the diagram by:
- Creating a parallel path for error handling.
- Using a specific message number for retry attempts (e.g., 1.5).
- Showing the fallback object that takes over when a primary service fails.
Security Contexts
Security tokens often pass between services. You can annotate the links to indicate:
- Where authentication is required.
- Where encryption is applied.
- Which links traverse public networks versus internal subnets.
📝 Best Practices for Clarity
Readability is paramount. A diagram that is too complex defeats the purpose. Adhere to these guidelines to maintain quality.
Limit Depth of Nesting
Avoid nesting messages too deeply (e.g., 1.1.1.1). If a process requires that many steps, consider breaking it into a separate diagram. High nesting levels confuse the reader about the hierarchy of interactions.
Use Consistent Naming
Ensure object names match the codebase. If the code uses UserService, the diagram should use UserService, not UserManager. This reduces the cognitive load when developers cross-reference documentation.
Keep Messages Concise
Label messages with the action, not the data payload. Instead of sendUserPasswordToServer, use authenticate. Detailed data structures belong in class diagrams, not interaction diagrams.
Group Related Interactions
If multiple objects interact frequently, consider grouping them visually or using a combined fragment notation. This helps the eye follow the specific logic cluster.
⚠️ Common Pitfalls to Avoid
Even experienced architects make mistakes. Watch out for these common errors.
- Ignoring Latency: Assuming all links are instant. In distributed systems, network hops matter. Annotate critical paths.
- Overloading the Diagram: Trying to show every possible edge case. Focus on the happy path and major error paths.
- Missing Return Messages: Forgetting to show the response. This makes it unclear if the transaction completes successfully.
- Inconsistent Link Direction: Mixing bidirectional and unidirectional links without clear reason. Use arrows to denote flow direction clearly.
📈 Impact on System Maintenance
Maintaining a distributed system over time is difficult without documentation. These diagrams serve as a living map of the system’s behavior.
- Onboarding: New developers can understand the architecture faster by reviewing these diagrams.
- Refactoring: When changing a service, the diagram helps identify which other components will break.
- Debugging: When logs show a failure, the diagram helps trace the expected path versus the actual path.
🔄 Updating for Evolution
Software evolves. Requirements change, and services split or merge. Your diagrams must evolve with them.
- Version Control: Treat diagrams as code. Store them in version control systems.
- Review Cycles: Include diagram updates in code review processes.
- Automated Generation: Where possible, generate diagrams from code annotations to ensure they stay in sync.
By maintaining accurate visual representations, teams ensure that the distributed logic remains understandable. This reduces the risk of introducing bugs during updates.
🎯 Summary of Key Takeaways
Effective modeling relies on choosing the right tool for the job. Communication diagrams excel at showing how objects are connected and how they exchange information across a network.
- Focus on Structure: Prioritize the links between objects over strict timing.
- Number Messages: Use clear numbering to define execution order.
- Context Matters: Tailor the diagram to the specific distributed system challenges you face.
- Keep it Clean: Avoid clutter and stick to standard notation.
Adopting these practices leads to more resilient architectures. Teams spend less time guessing how data moves and more time building reliable features.