


Building software is like constructing a skyscraper. You cannot simply start pouring concrete without a blueprint. For many junior developers, the leap from writing code to designing system architecture feels overwhelming. This is where Visual UML becomes essential. It transforms abstract logic into clear, visual representations that teams can understand, critique, and refine.
Understanding how to model your systems before writing a single line of code saves countless hours of refactoring later. This guide provides a comprehensive look at how to use Unified Modeling Language (UML) to design robust, scalable architectures. We will explore the core concepts, the specific diagram types you need, and a practical workflow to follow.
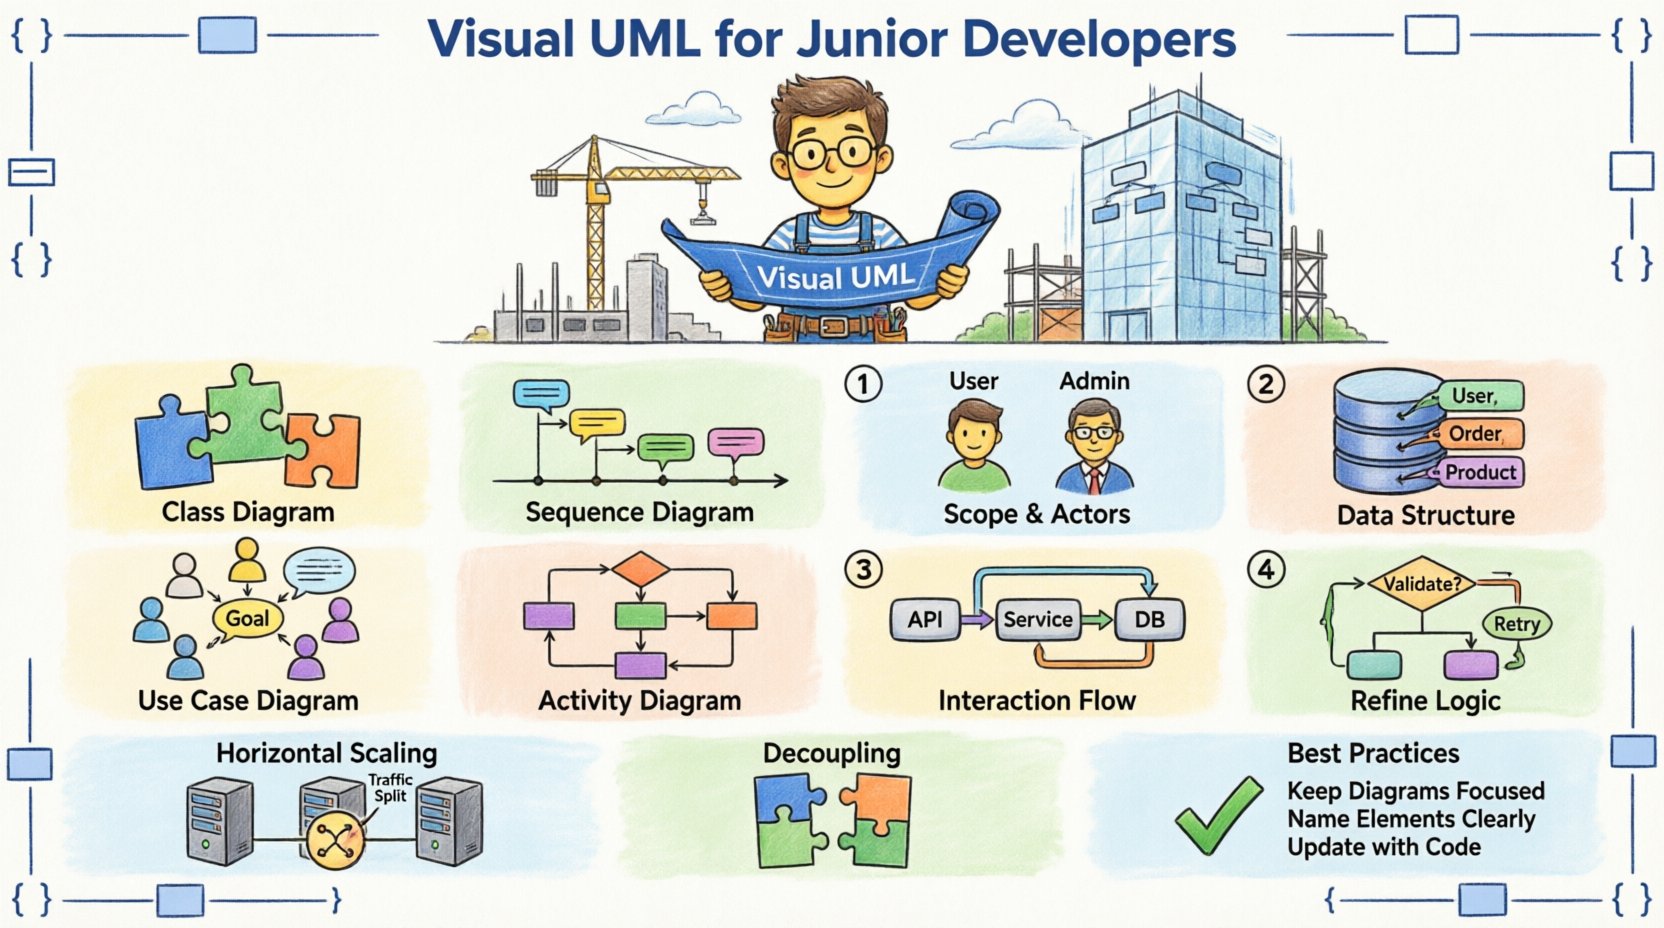
🤔 Why Visual UML Matters for Scalability 🏗️
Scalability is not just about handling more traffic; it is about maintaining structure as complexity grows. When you rely solely on code, hidden dependencies and coupling issues often surface only during production. Visual modeling exposes these risks early.
- Communication: Diagrams act as a shared language between developers, product managers, and stakeholders.
- Clarity: Visualizing data flow helps identify bottlenecks before implementation.
- Documentation: Models serve as living documentation that evolves with the codebase.
- Design Patterns: UML helps you apply proven patterns like Observer or Factory systematically.
Without visual aids, junior developers often fall into the trap of over-engineering or under-estimating requirements. A well-drawn diagram forces you to think about edge cases and data relationships explicitly.
📊 The Core Diagram Types You Need to Know 🧠
UML consists of various diagram types, but you do not need to master all of them immediately. Focus on the structural and behavioral diagrams that directly impact system design.
| Diagram Type | Focus Area | When to Use |
|---|---|---|
| Class Diagram | Static Structure | Defining data models, entities, and relationships |
| Sequence Diagram | Dynamic Behavior | Mapping interactions between objects over time |
| Use Case Diagram | Functional Requirements | Understanding user goals and system boundaries |
| Activity Diagram | Process Flow | Visualizing business logic and decision points |
1. Class Diagrams: The Backbone of Structure 🔗
The Class Diagram is the most common UML artifact. It maps out the classes in your system, their attributes, methods, and the relationships between them. This is critical for database design and API structure.
- Attributes: Define the data stored within an entity (e.g.,
username,balance). - Methods: Define the actions an entity can perform (e.g.,
withdraw(),login()). - Relationships: Show how entities connect (e.g., One-to-Many, Composition, Aggregation).
When designing for scalability, pay close attention to cardinality. If a Customer class has a relationship with an Order class, is it one-to-one or one-to-many? This decision dictates how your database indexes are built and how queries are optimized.
2. Sequence Diagrams: Timing and Flow ⏱️
While Class Diagrams show what exists, Sequence Diagrams show how it works over time. They place objects on a vertical timeline and use arrows to represent messages passed between them.
For a junior developer, this diagram is invaluable for understanding API integrations. It helps answer questions like:
- Does the payment gateway respond synchronously or asynchronously?
- What happens if the third-party service times out?
- Which object is responsible for validating the input?
By visualizing the lifecycle of a request, you can spot potential race conditions or blocking calls that might slow down your system under load.
🛠️ Step-by-Step Walkthrough: Designing a System 🗺️
Let us walk through a practical scenario. Imagine you are building a notification service that sends emails and SMS alerts to users. We will move from concept to concrete diagrams.
Step 1: Define the Scope and Actors 🎯
Start with a Use Case Diagram. Identify who interacts with the system and what they want to achieve.
- Actor: User (triggers notification).
- Actor: Admin (configures templates).
- Actor: External Service (Email/SMS provider).
List the specific use cases:
- Send Notification: The user triggers an event.
- Retrieve Template: The system fetches the message content.
- Log Delivery: The system records success or failure.
Step 2: Model the Data Structure 💾
Now, create the Class Diagram. Define the entities involved.
- User: ID, Email, Phone, Preferences.
- NotificationTemplate: ID, Subject, Body, ChannelType.
- NotificationLog: ID, UserID, Status, Timestamp.
Draw the connections. A User can have many Notifications, but a Notification belongs to one User. This is a classic One-to-Many relationship. Ensure your model supports indexing on UserID for fast lookups.
Step 3: Map the Interaction Flow 🔄
Create a Sequence Diagram for the primary flow: Sending a Notification.
- Controller: Receives request from User.
- Service: Validates User preferences.
- Repository: Fetches the correct Template.
- Gateway: Sends message to External Provider.
- Service: Updates Log with Status.
Notice the synchronous calls. If the External Provider is slow, the Controller might hang. A scalable design often introduces a queue or background job. You can represent this in the diagram by showing an asynchronous arrow or a separate thread.
Step 4: Refine with Activity Diagrams 📝
For complex logic, use an Activity Diagram. This is like a flowchart but with swimlanes to show who is responsible for each step.
Example: Handling a Failed Notification.
- Decision Point: Was the delivery successful?
- Yes: End process.
- No: Check retry limit.
- Retry Limit Reached: Alert Admin.
- Retry Limit Not Reached: Wait 5 minutes, Retry.
This level of detail ensures your error handling is robust before you write the if/else statements.
📈 Designing for Scalability with UML 🚀
Scalability is not an afterthought; it is a design constraint. UML helps you visualize scaling strategies.
Horizontal vs. Vertical Scaling 📉
When modeling your services, consider how they will grow.
- Vertical Scaling: Adding more power to a single node. Easy to model, but has limits.
- Horizontal Scaling: Adding more nodes. Requires stateless design and load balancing.
In your Class Diagram, look for stateful dependencies. If your Session class stores data locally, horizontal scaling will break the user experience. You should model a shared Cache or Database instead.
Decoupling Components 🧩
High coupling leads to fragile systems. Use UML to visualize dependencies.
- Dependency Arrow: Indicates one class uses another.
- Interface: Define contracts to reduce direct dependency.
If OrderService depends directly on EmailService, changing the email provider breaks the ordering system. Use an interface or an event bus pattern. In your diagram, show the OrderService sending an event, and a separate EmailListener consuming it. This decoupling allows you to scale the email processing independently.
⚠️ Common Pitfalls to Avoid ⛔
Even experienced architects make mistakes. Junior developers should be aware of these common traps when using Visual UML.
- Over-Modeling: Do not draw every single variable. Focus on the architecture, not the implementation details.
- Ignoring Time: Sequence diagrams often omit error paths. Always include failure scenarios.
- Static Assumptions: A diagram drawn today may be obsolete tomorrow. Treat models as drafts, not final contracts.
- Tool Dependency: Do not rely on the tool to design for you. The thinking happens in your head, the tool just records it.
🔄 Integrating UML into Your Workflow 🔄
How do you keep modeling relevant in a fast-paced development cycle?
1. Keep It Lightweight
Use quick sketches or digital whiteboards for initial brainstorming. Reserve detailed diagrams for complex subsystems.
2. Treat Models as Code
Store your diagram files in your version control system alongside your source code. This ensures that changes to the architecture are reviewed during pull requests.
3. Review During Planning
Include diagram reviews in your sprint planning meetings. This ensures everyone agrees on the design before development begins.
4. Update During Refactoring
When you refactor code, update the diagrams. If the code changes and the model does not, the model becomes misleading.
🧩 Advanced Patterns in Modeling 🧩
As you grow, you will encounter more complex architectural patterns. UML can represent these effectively.
Microservices Architecture 🌐
For distributed systems, use a component diagram to show how services communicate. Indicate the protocol (HTTP, gRPC, Message Queue) on the connecting lines. This helps identify network latency points.
Event-Driven Design ⚡
In event-driven systems, the flow is not linear. Use Activity Diagrams to show triggers and listeners. Clearly mark which events are mandatory and which are optional.
Database Sharding 🗃️
When scaling databases, you need to show how data is partitioned. In your Class Diagram, annotate tables with @shard(key) to indicate which field determines the shard location.
📝 Summary of Best Practices ✅
To wrap up this walkthrough, here are the core principles for success.
- Start Simple: Begin with Use Case and Class diagrams.
- Focus on Relationships: Understand how parts connect before defining parts.
- Validate Assumptions: Use Sequence diagrams to test logic flows.
- Iterate: Models evolve as the system evolves.
- Collaborate: Draw diagrams together with peers.
By adopting Visual UML, you move from writing code in isolation to designing systems with intention. This shift is what separates a coder from a software engineer.
🎓 Final Takeaways for Your Journey 🎓
Learning to model systems is a skill that compounds over time. It requires patience and practice. You will find yourself sketching diagrams in meetings, on napkins, or in the margins of your notes. This habit pays off when you face a complex bug or a sudden requirement change.
Remember that the goal is not perfection. The goal is clarity. If a diagram helps you and your team understand the system better, it has served its purpose. As you continue to build, keep refining your approach to visualization. The more you practice, the more intuitive the process becomes.
Start small. Pick a current project or a hypothetical feature. Draw the Class Diagram. Then draw the Sequence Diagram. See where the gaps in your understanding are. Fill them. This cycle of model, code, and review is the path to building scalable, maintainable software.
Happy modeling! 📐✨