


System analysis and design require precise documentation to ensure that software architects, developers, and stakeholders share a unified understanding of how information moves through a complex environment. Among the various modeling techniques available, the Data Flow Diagram (DFD) remains a cornerstone for visualizing data movement. However, relying solely on DFDs can lead to gaps in understanding, particularly when control logic or data structure becomes the primary focus. This guide explores the specific scenarios where DFDs are the optimal choice and identifies when alternative modeling techniques provide superior clarity.
Understanding the Data Flow Diagram 📝
A Data Flow Diagram represents the flow of data through a system. Unlike other diagrams that focus on the sequence of events or the physical storage of data, DFDs concentrate on the transformation of data. They answer the question: “Where does the data come from, where does it go, and how is it processed?”
DFDs are particularly valuable during the requirements gathering phase and the system analysis stage. They help identify processes, data stores, external entities, and the data flowing between them. By abstracting away the physical implementation details, DFDs allow analysts to focus on the logical flow of information.
Key Components of a DFD 🧩
To utilize DFDs effectively, one must understand the fundamental building blocks. These components are consistent across most methodologies:
- External Entities: These represent sources or destinations of data outside the system boundary. Examples include users, other systems, or hardware devices.
- Processes: These are actions or transformations performed on the data. They take input data and produce output data.
- Data Stores: These represent places where data is held for later use. They do not imply a specific technology but rather a logical location for persistence.
- Data Flows: These are the arrows connecting the components, indicating the direction and name of the data being transferred.
When to Use DFDs 🎯
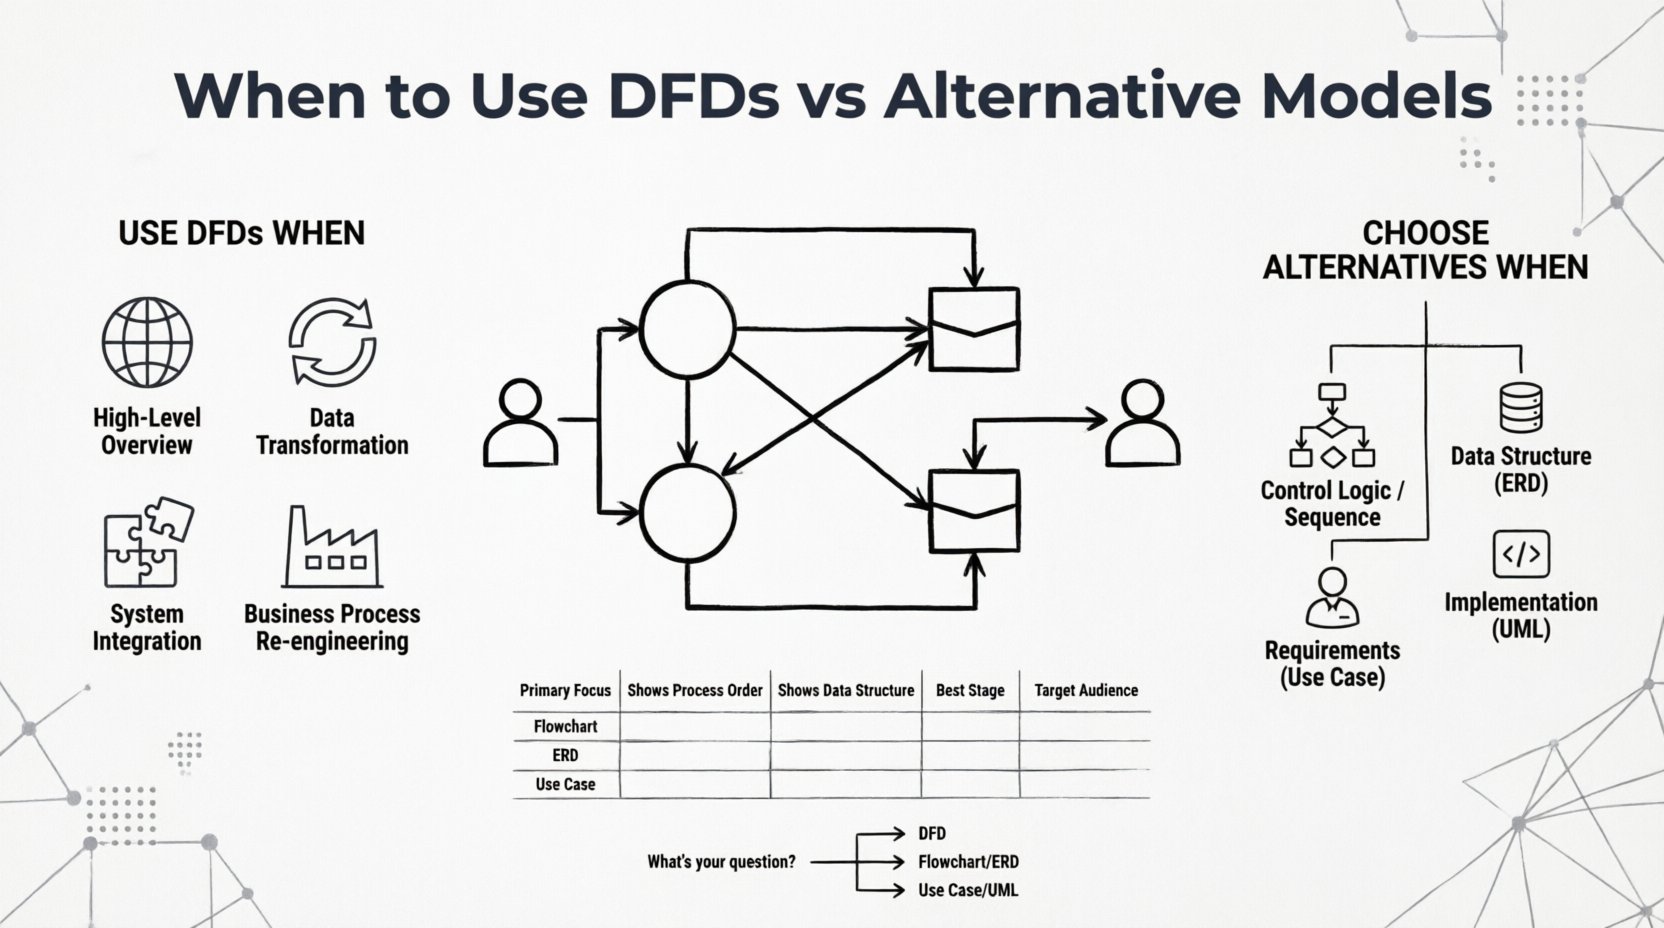
DFDs are not a universal solution for every modeling need. They shine in specific contexts where understanding the movement and transformation of information is critical. Below are the primary scenarios where utilizing a DFD is recommended.
1. High-Level System Overview 🌐
When initiating a project, stakeholders need a clear picture of the system’s scope without getting bogged down in technical details. A Context Diagram (Level 0 DFD) serves this purpose perfectly. It shows the entire system as a single process and illustrates the interactions with external entities.
- It defines the system boundary clearly.
- It highlights the major inputs and outputs.
- It facilitates communication with non-technical stakeholders.
2. Analyzing Data Movement and Transformation 🔄
If the primary concern is how information changes as it passes through the system, DFDs are the superior choice. They explicitly show where data is created, modified, or deleted.
- Ideal for financial systems where transaction data must be tracked.
- Useful for reporting systems where raw data is aggregated into summaries.
- Helpful in identifying bottlenecks where data accumulation occurs.
3. Defining System Boundaries for Integration 🚧
When integrating multiple systems or subsystems, understanding what data crosses the boundary is crucial. DFDs help define the interfaces between different modules.
- Clarifies which data is passed between microservices.
- Identifies dependencies between legacy systems and new applications.
- Ensures that no data is lost during handoffs between departments.
4. Business Process Re-engineering 🏭
DFDs are excellent for mapping current business processes (As-Is) and designing future states (To-Be). They allow analysts to visualize inefficiencies in how data is handled.
- Reveals redundant data entry points.
- Highlights unnecessary data storage locations.
- Supports the simplification of workflows by removing unnecessary processes.
Limitations of DFDs ⚠️
While powerful, DFDs have inherent limitations that dictate when they should be replaced or supplemented by other models.
- No Control Logic: DFDs do not show the order of execution. They do not indicate if Process A must finish before Process B starts.
- No Data Structure: DFDs do not define the schema of the data. They do not specify fields, data types, or relationships between data elements.
- No State Changes: They cannot represent the state of an object over time, such as an order moving from “Pending” to “Shipped”.
- No Physical Details: They do not show hardware, networks, or specific database technologies.
Alternative Modeling Techniques 🛠️
When the limitations of DFDs become apparent, other modeling techniques offer the necessary depth. Selecting the right tool depends on the specific questions the system design needs to answer.
1. Flowcharts 📈
Flowcharts focus on the control flow and logic within a system. They use symbols to represent decisions, loops, and sequential steps.
- Best Used For: Detailed logic for a specific algorithm or function.
- Key Difference: DFDs show data movement; Flowcharts show decision logic and sequence.
- When to Switch: When the order of operations matters more than the data itself.
2. Entity-Relationship Diagrams (ERD) 🗃️
ERDs model the data structure and relationships between data entities. They are the standard for database design.
- Best Used For: Designing the underlying database schema.
- Key Difference: DFDs show flow; ERDs show structure and cardinality.
- When to Switch: When defining tables, keys, and data integrity rules.
3. Use Case Diagrams 🎭
Use Case diagrams capture the functional requirements from the perspective of the user. They illustrate how actors interact with the system.
- Best Used For: Requirements gathering and user interaction analysis.
- Key Difference: DFDs show data; Use Cases show user goals and actions.
- When to Switch: When defining user stories and functional specifications.
4. Unified Modeling Language (UML) Class Diagrams 🏗️
UML Class Diagrams are used in object-oriented design to show the structure of classes, their attributes, and methods.
- Best Used For: Software architecture and implementation planning.
- Key Difference: DFDs are logical; Class Diagrams are structural and code-oriented.
- When to Switch: When moving from analysis to actual coding.
Comparison of Modeling Techniques 📊
To assist in decision-making, the following table compares the primary characteristics of DFDs against common alternatives.
| Feature | Data Flow Diagram (DFD) | Flowchart | Entity-Relationship Diagram (ERD) | Use Case Diagram |
|---|---|---|---|---|
| Primary Focus | Data movement and transformation | Control logic and sequence | Data structure and relationships | User interactions and goals |
| Shows Process Order? | No | Yes | No | Yes (via scenarios) |
| Shows Data Structure? | No | No | Yes | No |
| Best Stage | System Analysis | Design / Implementation | Database Design | Requirements Gathering |
| Target Audience | Analysts, Architects | Developers | DBAs, Developers | Stakeholders, Users |
Decision Framework for Model Selection 🧭
Choosing the right model is not always a binary decision. Often, a combination of diagrams provides the most complete picture. The following framework helps determine when to stick with DFDs and when to pivot.
Step 1: Analyze the Question 🤔
Start by identifying the core question you need to answer about the system.
- “How does data move?” ➝ Use DFD.
- “What is the logic flow?” ➝ Use Flowchart.
- “How is data stored?” ➝ Use ERD.
- “What does the user do?” ➝ Use Use Case.
Step 2: Identify the Audience 👥
Consider who will be reading the diagram. Technical teams may require more detail on structure, while business stakeholders may need a focus on processes.
- For business stakeholders, a Context Diagram often suffices.
- For developers, detailed logic flows or class diagrams are necessary.
- For database administrators, ERDs are essential.
Step 3: Assess the Complexity 🏗️
Simple systems may only require a single DFD. Complex enterprise systems often require a layered approach.
- Level 0 DFD: High-level overview for all stakeholders.
- Level 1 DFD: Detailed breakdown of major processes.
- Level 2 DFD: Specific sub-processes requiring logic detail.
Common Pitfalls to Avoid ⛔
Even when DFDs are the correct choice, common mistakes can reduce their effectiveness.
- Mixing Control and Data: Do not use DFDs to show decision logic. Keep data flow separate from control flow.
- Over-Abstraction: A DFD that is too high-level becomes useless. Ensure enough detail exists to guide implementation.
- Inconsistent Naming: Data flows must have consistent names across different levels of the diagram to maintain traceability.
- Ignoring Data Stores: Failing to identify where data is persisted can lead to a design that cannot actually function.
- Black Hole Processes: Every process must have both input and output. A process that consumes data but produces nothing is a logical error.
- Gray Hole Processes: A process that has output but no corresponding input is also a logical error.
Best Practices for DFD Modeling 🛡️
To ensure your DFDs remain accurate and useful, adhere to these established practices.
- Numbering System: Use a hierarchical numbering system (e.g., 1.0, 1.1, 1.2) to manage levels of detail.
- Decomposition: Break complex processes into smaller sub-processes until they are atomic (indivisible).
- Consistency: Ensure the inputs and outputs of a parent process match the sum of the inputs and outputs of its child processes.
- Validation: Review diagrams with end-users to confirm that the data flow matches their mental model of the work.
- Iterative Refinement: Treat DFDs as living documents. Update them as requirements change during the development lifecycle.
Integrating Multiple Models 🤝
In modern system design, relying on a single diagram is rarely sufficient. The most robust approach involves integrating DFDs with other models to cover all aspects of the system.
- DFD + ERD: Use DFDs to define the processes that manipulate data, and use ERDs to define the data structure those processes access.
- DFD + Use Case: Use Use Cases to define the triggers for the processes shown in the DFD.
- DFD + Flowchart: Use Flowcharts to detail the internal logic of specific nodes within the DFD.
Final Considerations 🔍
The choice between using a Data Flow Diagram or an alternative model depends entirely on the specific information gap you need to fill. DFDs excel at visualizing the movement of data and the transformation processes that occur within a system. They are indispensable for system analysis and requirements definition.
However, when the focus shifts to data structure, control logic, or user interaction, other models provide the necessary precision. By understanding the strengths and weaknesses of each technique, architects and analysts can construct a comprehensive documentation set that guides development without ambiguity.
Remember that the goal of modeling is clarity, not complexity. If a diagram confuses the reader, it has failed its purpose. Choose the tool that best communicates the intended message for the specific audience and phase of the project.