

The intersection of system design and continuous delivery often creates friction. On one side, Unified Modeling Language (UML) represents structured, static planning. On the other, DevOps emphasizes speed, automation, and constant change. When these two worlds collide, questions arise regarding the relevance of diagrams in a pipeline-first environment. This guide addresses the critical inquiries raised by engineering leaders regarding the role of architectural diagrams in modern continuous integration and continuous deployment workflows.
🤔 Is UML Still Relevant in a CI/CD World?
A common sentiment in high-velocity engineering teams is that documentation is a bottleneck. Many argue that code is the only source of truth. However, removing visual representation entirely can lead to architectural drift. The consensus among senior architects is not to abandon UML, but to evolve its application.
- Static vs. Dynamic: Traditional UML captures static structure. DevOps manages dynamic flow. Both are necessary for a complete picture.
- Communication Tool: Diagrams remain superior for onboarding and cross-team alignment compared to raw code snippets.
- Design Review: Visual models allow stakeholders to identify logic gaps before a single line of code is committed.
The value of UML lies not in its permanence, but in its ability to facilitate conversation. When a team moves to microservices, understanding the boundaries between services is crucial. A well-drawn component diagram can clarify ownership and dependency without requiring a code review.
⚙️ How Do We Automate Diagram Generation?
Manually updating diagrams leads to outdated information. This is the “documentation debt” that plagues many organizations. The solution involves treating diagrams as code. By integrating diagram generation into the build process, teams ensure that visual artifacts match the deployed state.
- Source Code Parsing: Tools can parse code structures to generate class and component diagrams automatically.
- Infrastructure as Code: When infrastructure is defined in code, the resulting network topology can be rendered dynamically.
- Version Control: Diagram files should live alongside source code in the repository, allowing for review and history tracking.
This approach reduces the maintenance burden. If the code changes, the diagram regenerates. This ensures that the documentation is always in sync with the artifact being deployed. It shifts the focus from maintaining a drawing to maintaining the logic that generates it.
📊 Mapping UML Artifacts to Pipeline Stages
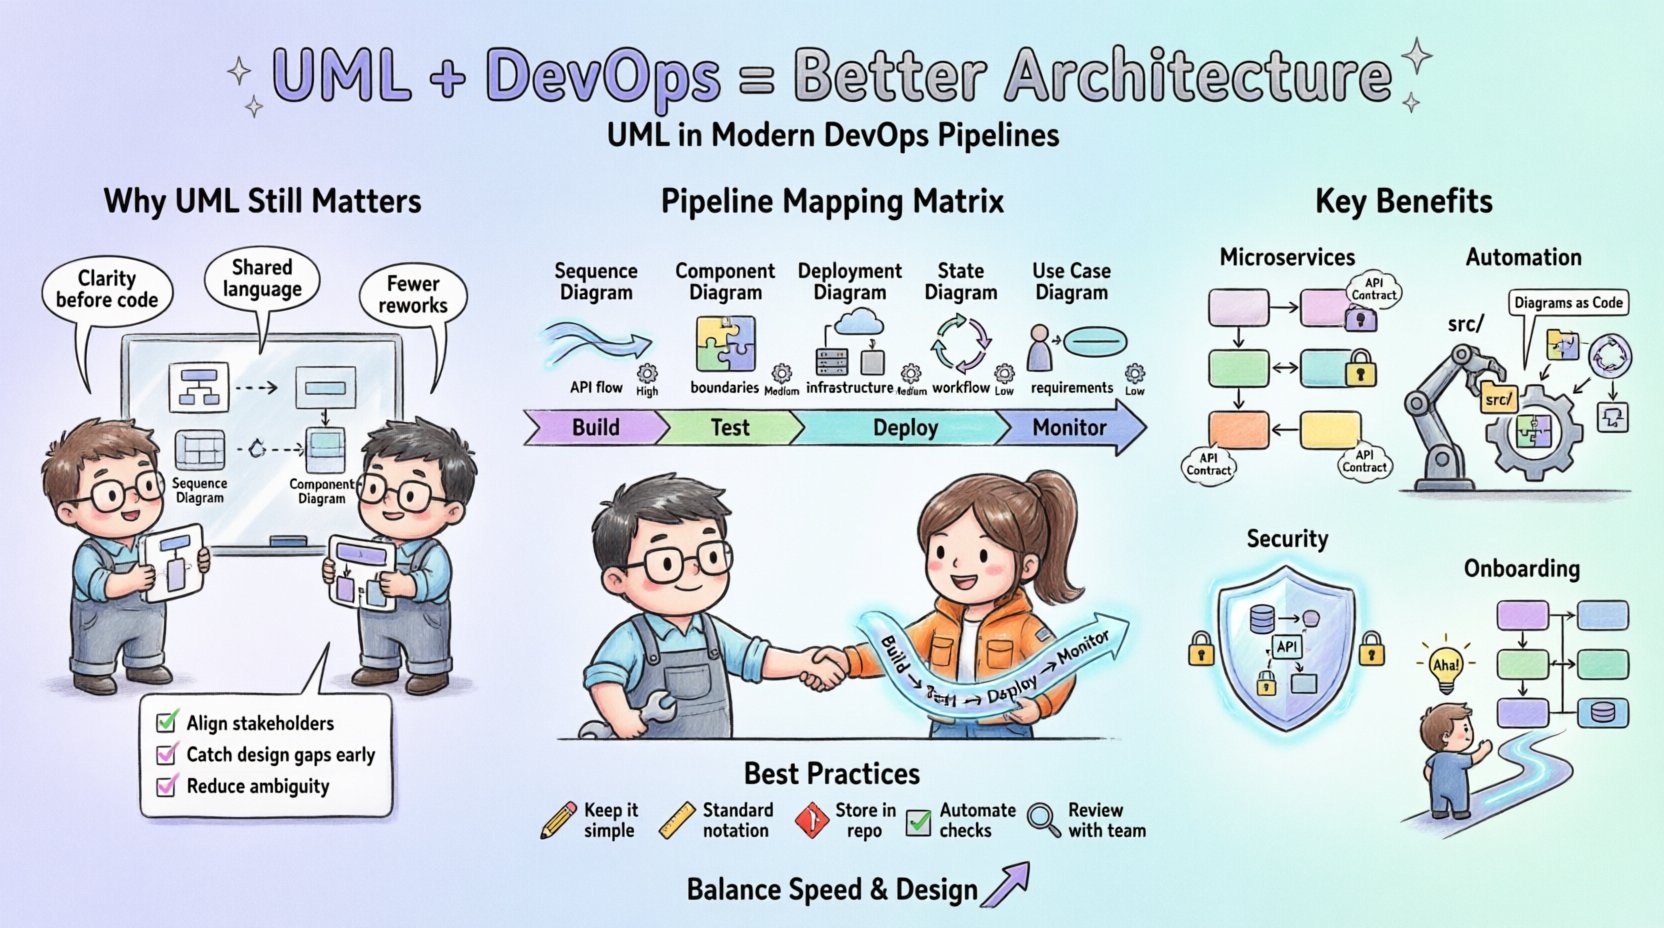
Not all diagrams are created equal, and not all are needed at every stage of the delivery pipeline. A matrix helps clarify which visual artifacts provide value during development, testing, and operations.
| UML Type | Primary Use Case | DevOps Stage | Automation Level |
|---|---|---|---|
| Sequence Diagram | API Interaction Flow | Integration Testing | High (via API specs) |
| Component Diagram | System Boundaries | Deployment Planning | Medium (via code scan) |
| Deployment Diagram | Infrastructure Topology | Infrastructure Provisioning | High (via IaC) |
| State Diagram | Workflow Logic | Unit Testing | Low (Manual/Review) |
| Use Case Diagram | Functional Requirements | Requirements Gathering | None (Manual) |
Understanding this mapping prevents teams from generating unnecessary visuals. For instance, a state diagram is less relevant in the deployment stage than a deployment diagram. Focusing effort where it matters most improves efficiency.
🏗️ Managing Architectural Drift in Microservices
Microservices architectures introduce complexity regarding service discovery and communication. Without clear boundaries, the system becomes a distributed monolith. UML helps define these boundaries explicitly.
- Service Contracts: Sequence diagrams define the expected input and output for service interactions.
- Failure Modes: Diagrams can illustrate how a service handles failures, which is critical for resilience testing.
- Dependency Management: Component diagrams highlight tight coupling that might cause cascading failures.
When architects define the system visually, they establish a contract that the code must fulfill. If the code deviates significantly from the design, it signals a potential risk. This visual contract acts as a guardrail for autonomous teams working on individual services.
👥 Who Owns the Diagrams?
In many organizations, documentation is left to junior engineers or dedicated technical writers. This often leads to content that does not reflect the reality of the system. Ownership should be distributed.
- Design Ownership: Architects define the initial model during the planning phase.
- Implementation Ownership: Developers update the diagrams when they refactor code or add features.
- Verification Ownership: QA engineers validate that the visual flow matches the test scenarios.
This distributed model ensures that everyone has a stake in the accuracy of the documentation. It prevents the scenario where a diagram is created once and never touched again. When ownership is shared, the maintenance cost is spread across the team.
🛡️ Security Implications of UML
Security is often an afterthought in design, but it should be integrated early. UML provides a mechanism to visualize security controls before they are implemented.
- Threat Modeling: Data Flow Diagrams help identify where sensitive data moves and where it is vulnerable.
- Authentication Flow: Sequence diagrams can map out how tokens are passed between services.
- Access Control: Component diagrams can show which services have access to specific resources.
By visualizing the security perimeter, architects can spot gaps that text-based requirements might miss. For example, a diagram might reveal that a legacy component is communicating directly with the internet, bypassing a proxy. This visibility allows for security controls to be inserted before the build process begins.
🔄 Handling Legacy Systems
Modernizing legacy systems is a common challenge. UML can serve as a bridge between old and new architectures. Reverse engineering tools can generate diagrams from existing codebases.
- Understanding the Black Box: Diagrams help new teams understand how legacy logic works without reading thousands of lines of code.
- Refactoring Plan: Architects can map out how to decompose a monolith into services using visual planning.
- Transition Mapping: Diagrams can show the path from the current state to the target state.
This is particularly useful when migrating to a cloud-native environment. Visualizing the current state provides a baseline for measuring the success of the migration. It ensures that no critical functionality is lost during the transition.
📝 Documentation vs. Code Reality
The gap between design and implementation is where most problems occur. Teams often prioritize speed over accuracy, leading to a “write-only” documentation strategy. This is unsustainable.
- Minimal Viable Documentation: Create only what is necessary for the current stage of the project.
- Living Documentation: Treat diagrams as living artifacts that evolve with the code.
- Review Cadence: Include diagram updates in the Definition of Done for every feature.
By making documentation part of the delivery checklist, teams ensure that the visual representation remains valid. This requires a cultural shift where documentation is seen as a deliverable, not an optional task.
🚀 Onboarding New Engineers
One of the highest ROI activities for UML is onboarding. New engineers struggle to understand system topology from code alone. Diagrams provide a high-level map that accelerates their learning curve.
- System Map: A single page overview of the entire ecosystem.
- Interaction Flow: Step-by-step visual guides for common user journeys.
- Deployment Path: Clear visuals of how code moves from repository to production.
Reducing the time it takes for a new hire to become productive is a significant cost saving. Visual aids reduce the burden on senior engineers who would otherwise spend hours explaining system architecture verbally.
🔗 Integration with Infrastructure as Code
Infrastructure as Code (IaC) defines the physical and logical environment. UML complements this by abstracting the IaC into human-readable forms.
- Network Topology: Deployment diagrams visualize how cloud resources connect.
- Resource Allocation: Component diagrams show which services consume which resources.
- Scaling Logic: State diagrams can illustrate how the system scales under load.
This integration ensures that the infrastructure matches the application requirements. If the application needs high throughput, the infrastructure diagram should reflect the necessary load balancers and caching layers. It prevents mismatches between code capacity and infrastructure capacity.
📉 Measuring the Value of UML
It is difficult to quantify the value of a diagram. However, teams can measure indirect benefits related to system stability and development velocity.
- Reduced Rework: Fewer bugs in production due to better upfront design.
- Faster Troubleshooting: Engineers spend less time guessing how components interact.
- Better Collaboration: Cross-team dependencies are clearer, reducing integration errors.
Tracking these metrics over time helps organizations decide if they are investing enough in architectural documentation. If troubleshooting time increases, it may indicate that the visual models are outdated or missing.
🛠️ Best Practices for Implementation
To succeed, teams must adopt specific practices that align with their workflow.
- Keep it Simple: Avoid over-detailing. A diagram should clarify, not confuse.
- Use Standard Notation: Stick to standard UML symbols to ensure everyone understands the meaning.
- Store in Code Repo: Keep diagrams in the same version control system as the application code.
- Automate Checks: Use scripts to validate that the diagram matches the code structure.
These practices create a sustainable environment where documentation is an asset rather than a burden. The goal is to make the diagram a natural part of the development lifecycle, not an add-on.
Final Thoughts on Architecture and Velocity
The debate between speed and design is not a binary choice. Organizations that succeed in modern DevOps find a balance where architecture supports velocity rather than hindering it. UML, when used correctly, provides the structure needed to scale safely. It allows teams to move fast without breaking the system.
By automating generation, distributing ownership, and focusing on high-value artifacts, teams can maintain a clear view of their systems. This clarity is essential for long-term stability and continuous improvement. The future of software architecture lies in the integration of visual design and automated delivery pipelines.
Senior architects agree that the key is not to abandon UML, but to adapt it. The principles remain valid: define boundaries, visualize flow, and communicate clearly. When these principles are applied within a DevOps context, the result is a robust, scalable, and maintainable system.