

In the complex landscape of software development and business process optimization, clarity remains the most scarce resource. Systems analysts bridge the gap between business requirements and technical implementation. To do this effectively, they require more than just verbal descriptions or fragmented documentation. They require a visual language that maps data movement and transformation. This language is the Data Flow Diagram (DFD). While methodologies evolve and tools shift, the fundamental necessity of understanding data flow remains constant. A deep dive into DFDs is not merely a technical exercise; it is a strategic imperative for any professional tasked with designing or analyzing systems.
Many enter the field believing that code is the primary output of analysis. However, before a single line of syntax is written, the logic must be sound. DFDs provide the blueprint for that logic. They allow analysts to visualize the movement of information through a system without getting bogged down in implementation details. This guide explores the critical role of Data Flow Diagrams in systems analysis, breaking down their components, levels, and practical applications.
Understanding the Core Purpose of DFDs 🧭
A Data Flow Diagram is a graphical representation of the flow of data through an information system. Unlike flowcharts, which focus on control flow and decision logic, DFDs focus strictly on data. They answer the question: Where does the data go, and how does it change?
For a systems analyst, this distinction is vital. Business stakeholders often speak in terms of processes and outcomes. Technical teams speak in terms of tables, functions, and APIs. DFDs act as the translation layer. They abstract the technical implementation details to focus on the functional requirements. This abstraction prevents premature optimization and ensures that the system design aligns with actual business needs.
Key Characteristics of a Proper DFD
- Focus on Data: The diagram tracks data entities, not the people who handle them.
- Process-Oriented: It highlights transformations where input data becomes output data.
- External Focus: It clearly defines boundaries between the system and external entities.
- Iterative: DFDs are rarely created in a single pass; they evolve from high-level concepts to detailed specifications.
The Anatomy of a Data Flow Diagram 🏗️
To utilize DFDs effectively, one must understand the standard symbols and conventions used to construct them. While specific software may use slightly different iconography, the underlying principles remain consistent across the industry.
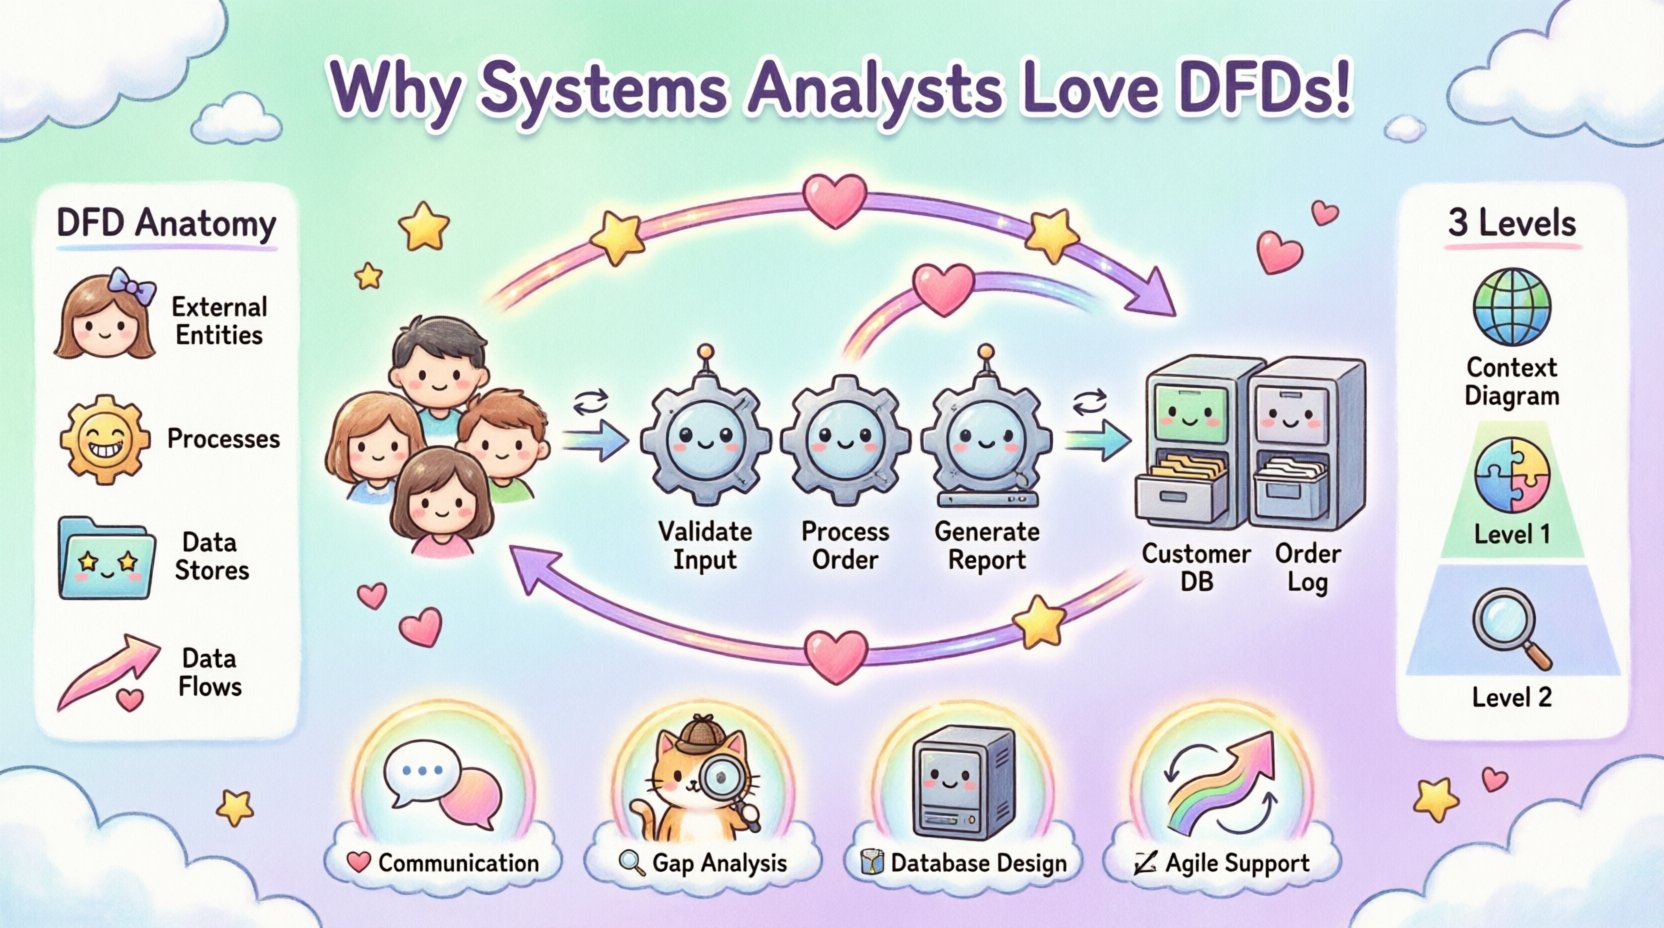
1. External Entities 👤
External entities (also known as terminators or sources/sinks) represent people, organizations, or other systems that interact with the system being modeled. They are the boundary of the scope.
- Source: Where data originates (e.g., a Customer, a Supplier).
- Sink: Where data ends up (e.g., a Report, an Archive).
- Constraint: Entities do not have data stores or processes inside them; they are purely external to the system boundary.
2. Processes ⚙️
Processes represent the work being done on the data. They transform input data into output data. A process is the engine of the system.
- Action-Oriented: Each process must have a verb-noun label (e.g., “Calculate Tax”).
- Transformation: Data must change in some way. If data flows in and out unchanged, it is not a process; it is a flow.
- Uniqueness: Every process should be unique and numbered for reference.
3. Data Stores 📂
Data stores represent where data is held at rest. This could be a database, a file system, or even a physical filing cabinet.
- Passive Storage: Data stores do not initiate action. They wait for a process to read or write to them.
- Consistency: Data must be consistent with the entities and flows connected to it.
- Identification: Proper naming conventions are crucial for future maintenance and understanding.
4. Data Flows 🔄
Data flows are the arrows connecting the other elements. They show the direction of data movement.
- Labeling: Every arrow must be labeled with the name of the data passing through it.
- Direction: Arrows indicate the direction of the flow, not the physical movement of the data.
- Decomposition: Flows can be broken down into sub-flows as the diagram becomes more detailed.
Levels of DFD Decomposition 📉
One of the greatest strengths of DFDs is their ability to decompose. A system is too complex to understand in a single view. Therefore, analysts create a hierarchy of diagrams. This allows stakeholders to view the big picture while drilling down into specific logic.
Level 0: The Context Diagram 🌍
The Context Diagram is the highest level of abstraction. It shows the entire system as a single process and identifies all external entities interacting with it.
- Scope Definition: It clearly defines what is inside the system and what is outside.
- Interface Identification: It highlights the primary inputs and outputs.
- Validation: It is the first step in validating the scope with business stakeholders.
Level 1: The Functional Breakdown 🧩
Level 1 diagrams take the single process from the Context Diagram and decompose it into major sub-processes. This level introduces data stores and provides a better view of the internal logic.
- Major Functions: Identifies the main functional areas (e.g., Order Processing, Inventory Management).
- Internal Flow: Shows how data moves between the major sub-processes.
- Storage Points: Reveals where data is persisted during the workflow.
Level 2: Detailed Logic 🔍
Level 2 diagrams decompose the processes from Level 1 further. This is where the specific logic of the system is defined in detail.
- Granularity: Suitable for developers to understand specific requirements.
- Complexity: Can become cluttered; best used only for the most critical processes.
- Validation: Essential for testing scenarios and edge case identification.
| Level | Focus | Target Audience | Complexity |
|---|---|---|---|
| Context | System Boundary | Stakeholders, Management | Low |
| Level 0 | Major Processes | Project Managers, Lead Analysts | Medium |
| Level 1 | Sub-Processes | Developers, Testers | High |
| Level 2+ | Specific Logic | Technical Team | Very High |
Why DFDs Are Essential for Systems Analysts 💡
The transition from requirements gathering to system design is fraught with ambiguity. DFDs mitigate this risk by enforcing structure and logic. Here is why a deep dive into this methodology is non-negotiable for professional growth.
1. Enhanced Communication 🗣️
Technical jargon creates barriers. A DFD allows a business user to look at a diagram and understand the data journey without needing to know SQL or API structures. It democratizes the understanding of the system.
- Visual Language: Everyone understands arrows and boxes better than dense text.
- Feedback Loop: Stakeholders can spot missing data flows immediately during review sessions.
- Shared Vocabulary: Creates a common reference point for all project participants.
2. Gap Analysis and Validation 🕵️
When modeling a system, it is easy to overlook a step. DFDs force the analyst to trace every piece of data from origin to destination. This process reveals gaps in logic.
- Missing Inputs: If a process has output but no input, the data is created from nowhere.
- Missing Outputs: If a process has input but no output, the data is lost.
- Data Conservation: Ensures no data is created or destroyed without a valid process.
3. Foundation for Database Design 🗄️
Data stores in a DFD directly correlate to tables in a relational database. A well-constructed DFD provides a roadmap for database schema design.
- Normalization: Helps identify which data needs to be stored together.
- Relationships: Clarifies how different data entities relate to one another.
- Efficiency: Prevents over-engineering by showing exactly what data is required.
4. Support for Agile and Iterative Development 🔄
Even in agile environments, where documentation is sometimes minimized, understanding flow is critical. DFDs can be created incrementally alongside sprints.
- Backlog Refinement: Helps break down user stories into functional components.
- Sprint Planning: Clarifies dependencies between features.
- Technical Debt: Visualizing the system helps identify areas that need refactoring.
Common Pitfalls in DFD Modeling ⚠️
Creating a DFD is an art that requires discipline. Certain mistakes are common and can lead to significant confusion later in the development lifecycle.
1. The Black Hole
A black hole occurs when a process has inputs but no outputs. The data disappears into the void. This indicates a missing requirement or a logic error.
2. The Miracle Process
This is the opposite of a black hole. A miracle process has outputs but no inputs. It implies the system is generating data from nothing. This must be validated against actual system capabilities.
3. Mixing Control and Data Flow
DFDs are not flowcharts. Including decision diamonds or control logic (like “If X, then Y”) confuses the data model. Control logic belongs in pseudocode or process specifications, not on the DFD.
4. Inconsistent Granularity
Some processes should be broken down further, while others are too detailed. Mixing high-level and low-level processes in the same diagram makes it difficult to read and maintain.
5. Ignoring Data Validation
DFDs often assume data is perfect. In reality, data must be validated before processing. Analysts should note validation steps in accompanying documentation, even if they are not explicitly modeled as separate processes.
Integrating DFDs into the SDLC 🚀
Data Flow Diagrams are not static artifacts. They evolve throughout the Software Development Life Cycle (SDLC). Here is how they fit into each phase.
Requirements Gathering
- Use Context Diagrams to establish scope.
- Conduct workshops to identify external entities.
- Validate the high-level flow with business owners.
System Analysis
- Create Level 0 and Level 1 diagrams.
- Identify bottlenecks in data movement.
- Define data stores and their relationships.
System Design
- Translate DFD data stores into database schemas.
- Map processes to service endpoints or modules.
- Define API contracts based on data flows.
Testing
- Use DFDs to create test cases for data paths.
- Verify that all defined flows exist in the application.
- Ensure no unauthorized data flows are introduced.
Maintenance
- Update diagrams when features are added.
- Use diagrams to impact analysis before changes.
- Archive old versions for historical reference.
Real-World Application Scenarios 🏢
To illustrate the value of DFDs, consider how they apply to different industry contexts.
Financial Services
In banking, data integrity is paramount. A DFD helps map the flow of transaction data from entry to ledger posting. It ensures that no step is skipped, which is crucial for regulatory compliance.
Healthcare Systems
Patient data flow involves multiple departments. A DFD clarifies how information moves from admission to billing to clinical records, ensuring privacy and accuracy.
E-Commerce Platforms
Order processing requires coordination between inventory, payment, and shipping. A DFD helps visualize the dependencies, preventing situations where an order is confirmed before payment is verified.
The Future of Process Modeling 🌐
As systems become more distributed and cloud-native, the need for clear data modeling increases. Microservices architecture relies heavily on defined data contracts. DFDs provide the high-level view of how these services interact.
- Cloud Migration: Helps visualize data movement between on-premise and cloud environments.
- API Economy: DFDs serve as the documentation for API interactions.
- Data Governance: Helps identify where sensitive data resides and how it moves.
While new tools emerge, the logic of DFDs remains the backbone of systems thinking. Analysts who master this skill position themselves as critical assets in any technology organization.
Final Thoughts on Systems Analysis 📝
The journey from a vague business need to a functional system is paved with data. Data Flow Diagrams are the map for this journey. They force clarity, expose errors, and facilitate communication. For a systems analyst, neglecting the DFD is akin to navigating a new city without a map. The destination might be reached, but the path will likely be inefficient and prone to getting lost.
Investing time in creating accurate, comprehensive diagrams yields dividends in development speed, reduced rework, and higher quality software. It is a foundational skill that separates casual observers from true architects of information systems.