

Creating a clear and effective visual representation of a software system is a critical skill for any architect or developer working with distributed systems. When dealing with microservices, the complexity increases significantly due to the decentralized nature of the architecture. A UML component diagram serves as the blueprint for understanding how distinct parts of the system interact without revealing implementation details. This guide provides a structured approach to designing these diagrams from the ground up, focusing on clarity, maintainability, and architectural integrity.
Whether you are starting a new project or documenting an existing legacy system, the ability to abstract complexity into manageable components is essential. We will explore the fundamental elements, the process of defining boundaries, and the strategies for managing dependencies. This is not about using a specific tool, but about understanding the underlying principles of system modeling.
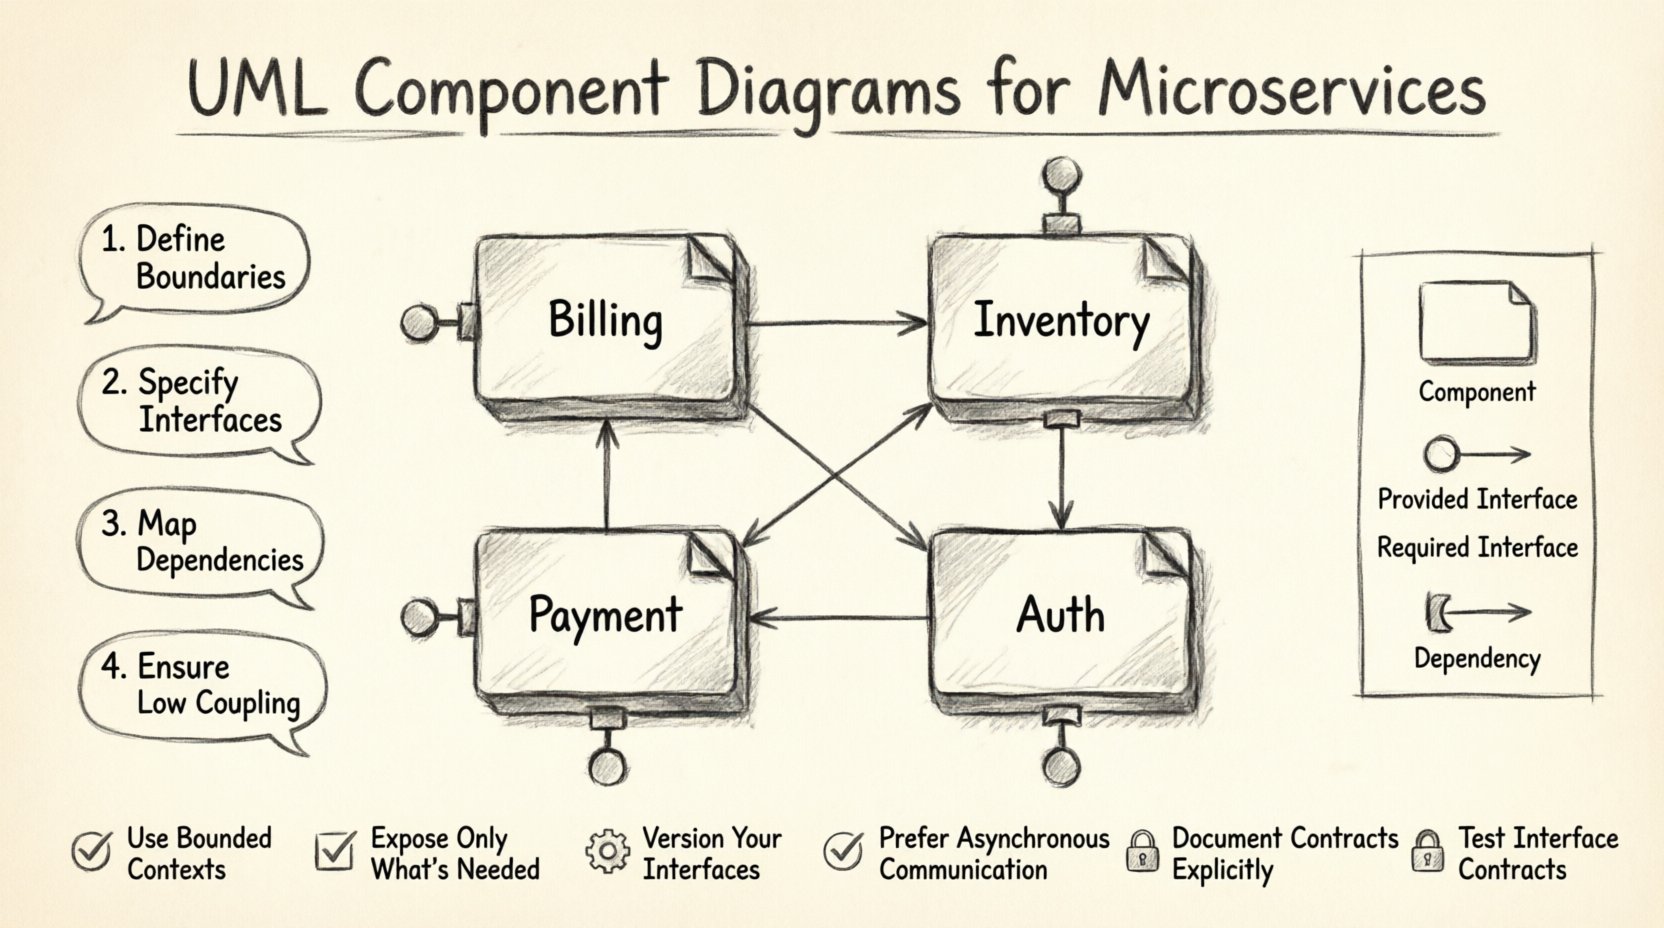
Understanding the Component Diagram in Microservices 🧩
A component diagram is a static structural diagram that describes the organization and structure of a system. In the context of microservices, it maps out the logical building blocks of your application. Unlike a class diagram, which focuses on code structure, a component diagram operates at a higher level of abstraction. It treats a set of classes or a service as a single unit with defined interfaces.
Key Objectives of the Diagram:
- Clarify Boundaries: Define what is inside a service and what is outside.
- Define Contracts: Specify the interfaces a component exposes to others.
- Visualize Dependencies: Show how components rely on one another.
- Support Deployment: Provide a logical view that can guide physical deployment strategies.
Microservices architecture relies on loose coupling and high cohesion. The component diagram is the primary artifact used to communicate this relationship to stakeholders, developers, and DevOps teams.
Core Concepts: Components, Interfaces, and Ports 🔌
To build a robust diagram, one must first master the notation and the semantics of the elements involved. A component is represented as a rectangle with two tabs on the top left. It encapsulates implementation details. The interface is the contract. It does not reveal how the service works, only what it can do.
Essential Notation Elements:
- Component: The modular unit of the system. In microservices, this is typically an individual service.
- Interface: A set of operations provided or required by the component.
- Port: A specific interaction point on a component where interfaces are exposed or needed.
- Dependency: A relationship indicating that one component relies on another.
There are two primary types of interfaces to consider:
- Provided Interface (Lollipop): Represented by a circle attached to a line. This indicates what the component offers to the outside world.
- Required Interface (Socket): Represented by a half-circle or a socket shape. This indicates what the component needs from others to function.
Step 1: Identifying Logical Boundaries 🛑
The first step in the design process is defining the scope of each component. In a monolithic application, components might be modules within a single process. In microservices, they are distinct deployment units. The goal is to separate concerns effectively.
Criteria for Component Definition:
- Business Capability: Does the component represent a specific business domain, such as “Billing” or “Inventory”?
- Data Ownership: Does the component have exclusive access to a specific dataset?
- Deployment Frequency: Should the component be deployed independently of others?
- Failure Isolation: If this component fails, does it bring down the entire system?
When drawing the diagram, avoid creating components that are too granular (like individual classes) or too broad (like the entire system). Aim for a level where each box represents a distinct service boundary.
Step 2: Defining Provided and Required Interfaces ⚙️
Once boundaries are set, you must define how they communicate. Interfaces are the contracts that ensure stability. If a component changes its internal logic but keeps the interface the same, dependent components do not need to be updated.
Designing the Interfaces:
- List Operations: Enumerate the specific actions a service can perform. For a “Payment” service, operations might include “ProcessCharge”, “RefundTransaction”, and “GetStatus”.
- Define Data Formats: Specify the input and output types. While the diagram does not show code, it should imply the data structures used in the contract.
- Mark Interfaces Clearly: Use the standard UML symbols. A lollipop on the provider side and a socket on the consumer side.
Interface Strategy Table:
| Interface Type | Symbol | Usage Context | Example |
|---|---|---|---|
| Provided (Lollipop) | Circle on line | Service exposes functionality | API Gateway |
| Required (Socket) | Half-circle | Service needs external help | Notification Service |
| Realization | Dashed line with triangle | Component implements an interface | Auth Service implements Security |
Step 3: Mapping Dependencies and Connections 🕸️
After defining what each component does, you must map how they talk to each other. Dependencies are the lines connecting the sockets and lollipops. These connections represent the flow of control or data.
Dependency Rules:
- Directionality: Always draw the arrow from the required interface (consumer) to the provided interface (provider). This indicates who depends on whom.
- Asymmetry: Avoid bidirectional dependencies where possible. If Service A talks to Service B, Service B should not necessarily talk back to Service A in the same context.
- Indirection: Use intermediate components like API Gateways or Message Brokers to reduce direct coupling.
When drawing these lines, ensure they do not cross unnecessarily. A cluttered diagram is hard to read. If lines must cross, consider using a different layout or introducing a middleware component.
Step 4: Refining for High Cohesion and Low Coupling 🧱
The ultimate goal of the design is to maximize cohesion within components and minimize coupling between them. This makes the system resilient and easier to evolve.
Checking Cohesion:
- Does every part of the component contribute to a single responsibility?
- Are all the operations on the interface related to the same domain?
Checking Coupling:
- Is the component dependent on the internal implementation of another?
- Can the component be replaced without affecting others?
If you find a component that requires too many interfaces from others, it is a sign of high coupling. You may need to refactor the component or introduce an adapter. Conversely, if a component exposes too many interfaces, it might be doing too much, suggesting a need for decomposition.
Common Mistakes to Avoid 🚫
During the design process, several common errors occur that degrade the quality of the diagram. Being aware of these pitfalls helps maintain accuracy.
- Over-Engineering: Trying to model every single method in the system. Stick to the high-level interfaces.
- Ignoring Data Flow: Focusing only on control flow and ignoring data dependencies.
- Inconsistent Naming: Using different names for the same interface or component across different diagrams.
- Missing Documentation: Not adding notes or legends to explain complex relationships.
Maintaining Diagram Accuracy Over Time 🔄
A diagram is only useful if it remains accurate. Software evolves, and if the diagram does not change with it, it becomes a source of confusion. Treat the diagram as a living document.
Maintenance Strategies:
- Version Control: Store diagram files alongside your code repository.
- Review Cycles: Update the diagram during code reviews or architectural discussions.
- Automation: Where possible, generate parts of the diagram from code or configuration files to ensure sync.
- Access Control: Ensure all team members have access to the latest version.
Regular maintenance prevents the diagram from becoming an artifact of the past. It ensures that new developers can understand the system quickly without needing to read through source code.
Advanced Considerations for Complex Systems 🌐
For larger microservices ecosystems, standard diagrams may not be enough. You may need to introduce grouping or nesting to manage complexity.
Grouping Strategies:
- Subsystems: Group related components into larger subsystems (e.g., “Ordering System”, “User Management”).
- Layers: Organize components by layer (Presentation, Business Logic, Data Access) if applicable.
- Deployment Views: Create a separate diagram that maps components to physical nodes (servers, containers, cloud regions).
When using grouping, ensure the boundaries of the groups are clear. Do not mix components from different domains in the same group unless there is a strong logical reason.
Summary of Best Practices ✅
To summarize the approach for creating a robust UML component diagram:
- Start with Boundaries: Define what each service owns.
- Define Contracts: Clearly mark provided and required interfaces.
- Minimize Connections: Reduce the number of dependency lines.
- Use Standard Notation: Stick to UML standards for clarity.
- Keep it Updated: Treat the diagram as a living document.
By following these guidelines, you create a visual asset that serves the entire team. It facilitates communication, reduces ambiguity, and supports the long-term health of the microservices architecture.