

Software architecture relies heavily on precise documentation to ensure systems function as intended. Among the various modeling techniques available, the Unified Modeling Language (UML) provides a standardized way to visualize system design. While class diagrams define the static blueprint of a system, object diagrams offer a snapshot of the system at a specific moment in time. This guide explores how to utilize UML object diagrams effectively, specifically focusing on their application in debugging sessions and runtime analysis.
When a system encounters an issue, static diagrams often fall short. They describe what should happen, not what is happening. Object diagrams bridge this gap by capturing runtime instances. By visualizing actual objects, their relationships, and current states, developers can pinpoint errors more efficiently. This approach transforms abstract code into tangible structures that can be inspected and analyzed.
📸 Understanding the Snapshot Concept
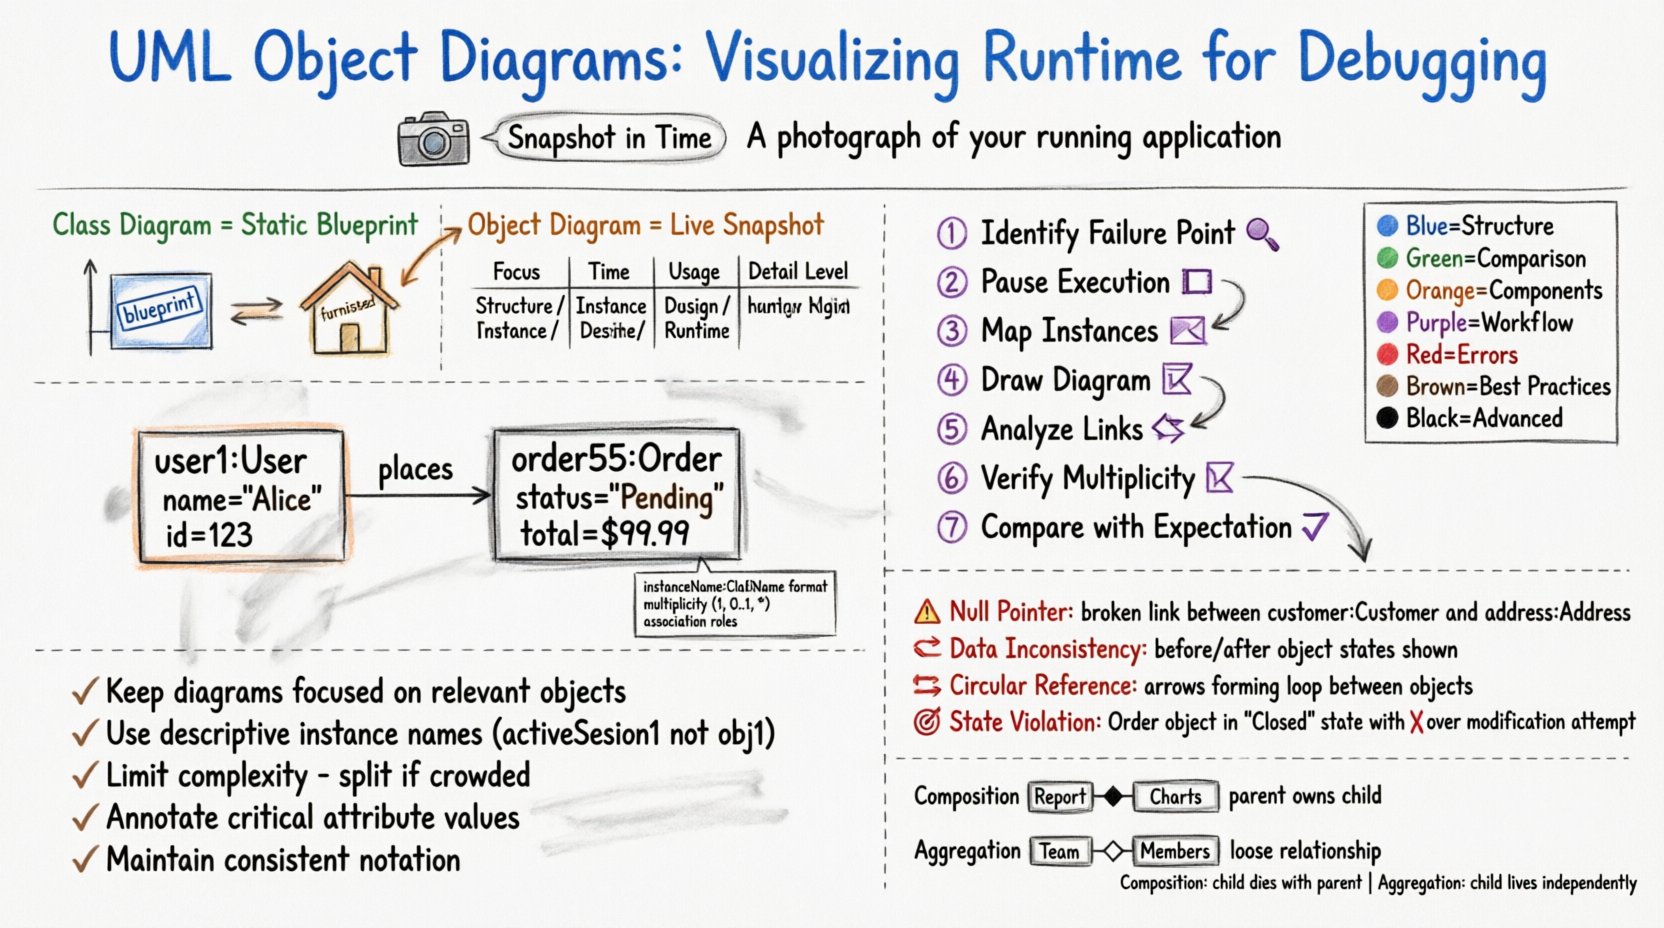
An object diagram represents a set of objects and their relationships at a particular instant. Think of it as a photograph of a running application. While a class diagram is like a blueprint for a house, an object diagram is the actual house with furniture placed in specific rooms. This distinction is critical for debugging.
- Static vs. Dynamic: Class diagrams define types. Object diagrams define instances.
- Temporal Specificity: An object diagram is valid only for a specific moment in the execution flow.
- State Visualization: It shows the current values of attributes within instances.
During a debugging session, developers often face issues where the code logic seems correct, but the data flow is broken. Object diagrams help clarify this by showing exactly which objects are linked, which are null, and what data they hold. This visibility reduces the time spent guessing about the system’s state.
🔧 Core Components of an Object Diagram
To construct a meaningful object diagram, one must understand its fundamental building blocks. Each element serves a specific purpose in defining the runtime structure.
- Object Instances: Represented as rectangles with the instance name in bold followed by the class name. The format is typically
instanceName:ClassName. - Links: Solid lines connecting instances that represent relationships defined in the class diagram.
- Association End Names: Labels on links indicating the role an instance plays in a relationship.
- Multiplicity: Indicators showing how many instances can be linked (e.g., 1, 0..1, *).
- Attribute Values: Sometimes, attribute values are displayed inside the object rectangle to show current state.
Consider a scenario where a user places an order. A class diagram defines the Order and User classes. An object diagram for that specific moment would show a specific user instance (e.g., user1:User) linked to a specific order instance (e.g., order55:Order).
📊 Object Diagrams vs. Class Diagrams
Understanding the difference between these two diagram types is essential for selecting the right tool for the task. Below is a comparison to clarify their distinct roles in the development lifecycle.
| Feature | Class Diagram | Object Diagram |
|---|---|---|
| Focus | Static structure and types | Dynamic instances and state |
| Time | Timeless (applies to all instances) | Specific moment in time |
| Usage | Design phase, API definition | Debugging, runtime analysis |
| Detail Level | Defines methods and attributes | Shows actual data values |
| Complexity | Lower (fewer elements) | Higher (more specific elements) |
When debugging, the object diagram provides the granular detail required to trace data flow issues that the class diagram cannot reveal.
🛠️ The Debugging Workflow with Object Diagrams
Integrating object diagrams into a debugging workflow requires a structured approach. It is not enough to simply draw the diagram; it must be used actively to isolate faults. The following steps outline a robust process.
- Identify the Failure Point: Locate the specific method or function where the error occurs.
- Pause Execution: Stop the application at the point of failure to capture the current state.
- Map Instances: Identify the relevant objects involved in the failing operation.
- Draw the Diagram: Create an object diagram representing the current memory state.
- Analyze Links: Check if associations exist as expected. Are references null?
- Verify Multiplicity: Ensure the number of linked objects matches the business logic rules.
- Compare with Expectation: Contrast the actual diagram with the intended design.
This process transforms debugging from a guessing game into a systematic investigation. By visualizing the state, developers can often see the root cause immediately.
🐛 Common Debugging Scenarios
Certain types of errors benefit more from object diagrams than others. Below are common scenarios where visualizing runtime instances proves invaluable.
1. Null Pointer Exceptions
One of the most frequent errors involves accessing a property on a null reference. An object diagram can quickly show that a link between two objects does not exist. If the diagram shows no line connecting customer:Customer to address:Address, the code attempting to access the address will fail.
2. Data Inconsistency
When data seems to change unexpectedly, an object diagram can capture the state before and after an operation. Comparing the two diagrams reveals which object attributes were modified and which were not, helping to trace unintended side effects.
3. Circular References
Complex systems often involve objects referencing each other. If not managed correctly, this can lead to memory leaks or infinite loops. An object diagram highlights these cycles visually, allowing developers to break the loop or implement proper cleanup logic.
4. State Machine Violations
In systems with complex state transitions (e.g., an order moving from Pending to Shipped), an object diagram can verify if an object is in a valid state for the current operation. If an object is in a Closed state but the code attempts to modify it, the diagram exposes this conflict.
✅ Best Practices for Effective Modeling
To ensure object diagrams remain useful and maintainable, adhere to specific conventions. Poorly constructed diagrams can introduce more confusion than clarity.
- Keep It Focused: Do not attempt to model the entire system. Focus only on the objects relevant to the current debugging issue.
- Use Clear Naming: Instance names should be descriptive. Instead of
obj1, useactiveSession1. - Limit Complexity: If a diagram becomes too crowded, split it into multiple views focusing on different subsystems.
- Update Regularly: If the diagram is part of documentation, ensure it reflects the current codebase. Outdated diagrams are misleading.
- Annotate Critical Values: Highlight specific attribute values that are critical to the bug being investigated.
- Maintain Consistency: Use the same notation and style across all diagrams to ensure readability for the team.
Adopting these practices ensures that the diagrams serve as a reliable reference rather than a source of confusion.
⚠️ Limitations and Considerations
While powerful, object diagrams are not a silver bullet. They have inherent limitations that must be acknowledged to manage expectations.
- Static Representation of Dynamic Systems: A diagram is a snapshot. It cannot show the history of changes or the future state of the object.
- Scalability: Large systems generate massive numbers of instances. Creating a diagram for the entire runtime state is often impractical.
- Manual Effort: Creating diagrams manually is time-consuming. Automated tools can help, but they may not capture the context needed for debugging.
- Concurrency: Object diagrams typically do not represent concurrent threads or race conditions well, as they show a single point in time.
Developers should use object diagrams in conjunction with other debugging tools, such as logs, stack traces, and memory profilers, for a complete picture.
🔄 Integrating with Dynamic Systems
In modern software development, systems are rarely static. Integrating object diagrams into dynamic workflows requires flexibility. Here are strategies for keeping diagrams relevant in evolving environments.
- Automated Extraction: Where possible, use tools that can extract object graphs from the running application memory.
- Event-Based Diagramming: Create diagrams at specific events, such as the start of a transaction or the end of a request.
- Version Control: Treat diagrams as code. Store them in version control systems to track changes over time.
- Integration Testing: Use object diagrams to verify the state of the system after integration tests run.
By treating diagrams as part of the integration and testing pipeline, they become a permanent asset rather than a one-off artifact.
📝 Advanced Scenarios: Aggregation and Composition
Understanding the nuances of aggregation and composition is vital when modeling complex objects. These relationships define how strongly objects are coupled.
- Composition: Indicates a strong ownership. If the parent object dies, the child object dies. In an object diagram, this is shown with a filled diamond.
- Aggregation: Indicates a weak relationship. Child objects can exist independently of the parent. This is shown with a hollow diamond.
During debugging, confusion often arises when objects are deleted prematurely. An object diagram clarifies ownership. If a Report is composed of Charts, and the Report is destroyed, the diagram should reflect that the Charts are no longer accessible.
🎓 Conclusion
Utilizing UML object diagrams offers a significant advantage in understanding complex runtime behaviors. By shifting focus from static definitions to dynamic instances, developers gain a clearer view of system state during critical moments. This clarity accelerates the debugging process and reduces the likelihood of recurring errors.
While they require discipline to maintain, the insights gained from visualizing runtime instances are invaluable. When combined with other debugging techniques, object diagrams form a robust strategy for maintaining system health. Embracing this modeling approach leads to more stable, predictable, and maintainable software solutions.
Start incorporating these diagrams into your next debugging session. The visual context they provide can turn a confusing error log into a solvable puzzle.