

Data Flow Diagrams (DFD) serve as a foundational tool for visualizing how information moves through a system. They provide a clear picture of data inputs, processing steps, storage locations, and outputs. In the context of modern architecture, where complexity often grows exponentially, maintaining clarity is essential. This guide explores the mechanics, application, and strategic value of DFDs without relying on specific software tools.
What Is a Data Flow Diagram? 🤔
A Data Flow Diagram is a graphical representation of the flow of data through an information system. Unlike flowcharts, which focus on control flow and logic decisions, DFDs focus strictly on data movement. They help stakeholders understand where data originates, how it is transformed, where it is stored, and how it leaves the system.
The primary goal is to model the system from a functional perspective. It breaks down complex processes into manageable sub-processes, allowing analysts to identify bottlenecks, redundancies, or security gaps. This approach is particularly valuable during the requirements gathering phase.
- Focus: Data movement and transformation.
- Viewpoint: Functional decomposition.
- Notation: Typically uses a structured set of symbols.
- Usage: System analysis, design, and documentation.
Core Components of a DFD 🔧
To construct a meaningful diagram, one must understand the four fundamental elements. These symbols remain consistent regardless of the methodology used.
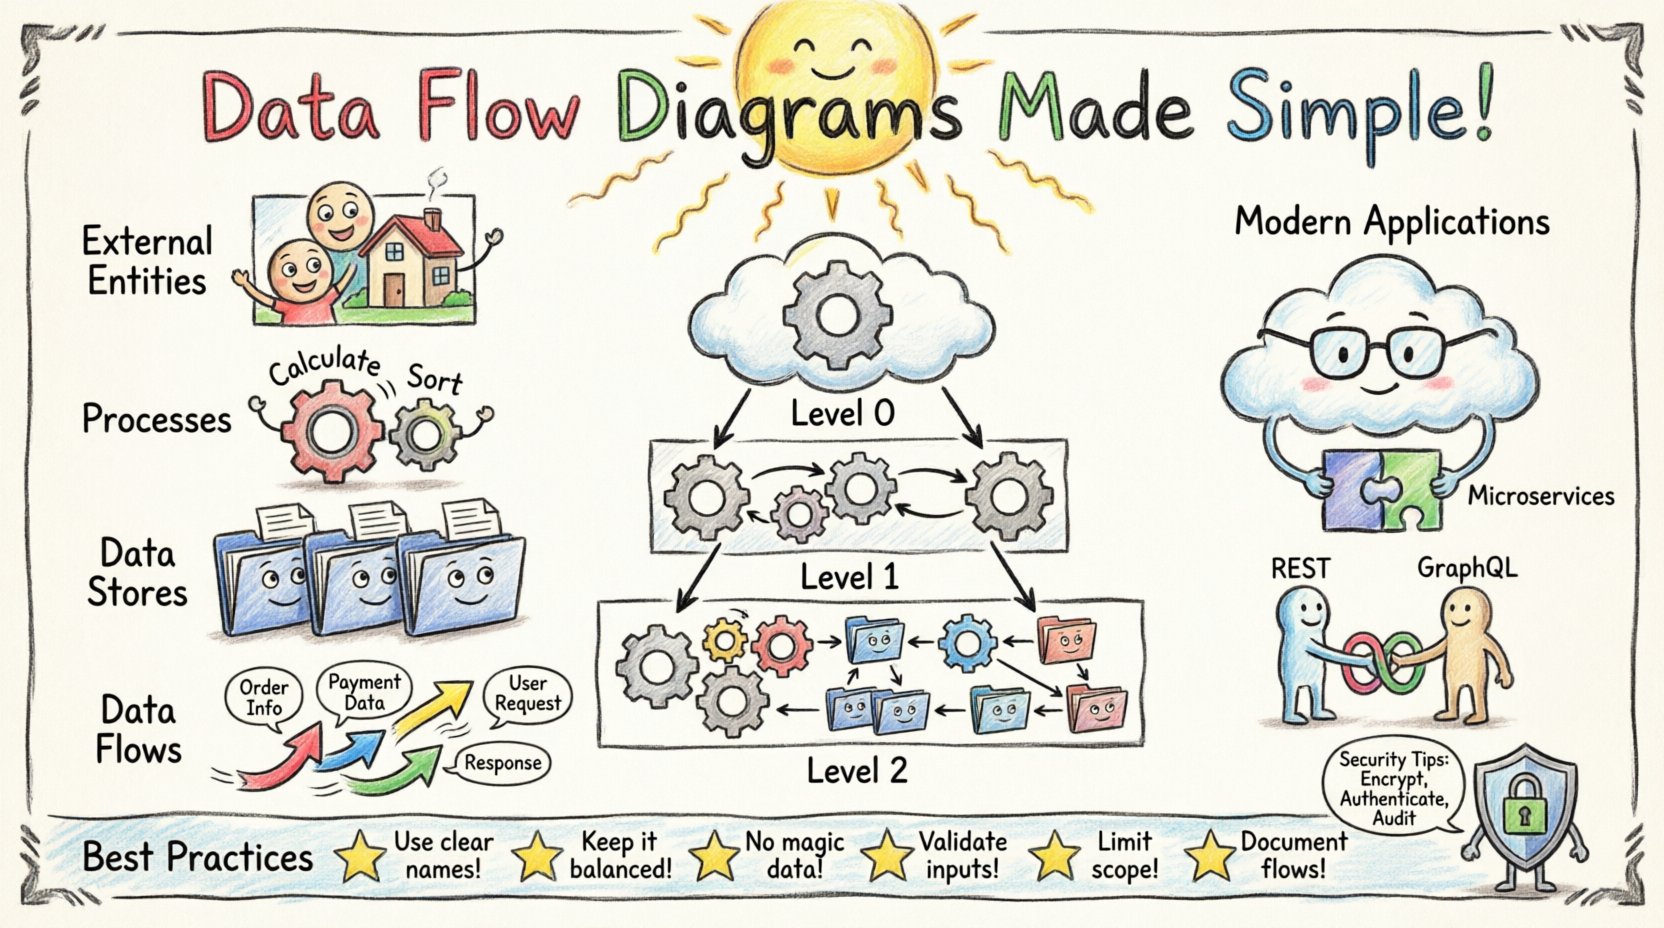
1. External Entities (Squares or Circles) 🟦
External entities represent sources or destinations of data outside the system boundary. These can be people, organizations, or other systems that interact with the primary system but are not part of it.
- Example: A customer placing an order.
- Example: A payment gateway processing a transaction.
- Example: A government tax database.
2. Processes (Circles or Rounded Rectangles) ⚙️
Processes transform incoming data into outgoing data. They represent the work being done within the system. Each process must have at least one input and one output.
- Function: Calculation, filtering, sorting, or aggregating data.
- Naming: Should use a verb-noun phrase (e.g., “Calculate Tax”).
- Constraint: Do not create loops unless they represent data storage retrieval.
3. Data Stores (Open Rectangles or Parallel Lines) 📂
Data stores hold information for later use. They represent any place where data is saved, whether it is a database, a file, or a physical archive.
- Direction: Data can flow in and out of stores.
- Types: Relational databases, flat files, or logs.
- Importance: Critical for understanding data persistence and integrity.
4. Data Flows (Arrows) ➡️
Arrows indicate the movement of data between entities, processes, and stores. They show the direction of information transfer.
- Labeling: Every arrow must be labeled with the name of the data packet.
- Meaning: Represents a single unit of information or a collection of related data.
- Control: Does not imply control logic, only data transfer.
Levels of Decomposition 📉
DFDs are typically created in a series of levels, starting from a high-level overview and moving down to specific details. This technique is known as “balancing” or “decomposition.”
Context Diagram (Level 0) 🌍
The Context Diagram is the highest level of abstraction. It shows the entire system as a single process and identifies the external entities that interact with it. It defines the system boundary clearly.
- Scope: One process representing the whole system.
- Input: Major data entering the system.
- Output: Major data leaving the system.
- Entities: All external actors involved.
Level 1 DFD (Major Processes) 🏗️
This level breaks the single process from the Context Diagram into major sub-processes. It provides a view of the main functional areas.
- Detail: Shows the primary data stores.
- Flow: Connects major processes to external entities.
- Clarity: Helps stakeholders see the big picture of functionality.
Level 2 DFD (Detailed Processes) 🔍
Level 2 diagrams decompose specific processes from Level 1 further. This is where specific logic and data transformations are visualized.
- Granularity: Focuses on specific business rules.
- Complexity: Can become large, so careful naming is required.
- Usage: Often used by developers for implementation guidance.
DFD vs. Other Diagramming Techniques 🆚
While DFDs are powerful, they are not the only tool available. Understanding when to use them versus other methods is crucial for effective system design.
| Diagram Type | Primary Focus | Best Used For |
|---|---|---|
| Data Flow Diagram (DFD) | Data movement and transformation | System analysis, functional requirements |
| Entity Relationship Diagram (ERD) | Data structure and relationships | Database design, schema definition |
| Flowchart | Control flow and logic decisions | Algorithm design, process logic |
| UML Sequence Diagram | Time-based interaction between objects | API interactions, message passing |
| System Architecture Diagram | High-level infrastructure and components | Deployment planning, hardware setup |
Applying DFDs in Modern Systems ☁️
The principles of DFDs remain valid even as technology evolves. Modern systems often involve microservices, cloud computing, and APIs. Adapting the methodology to these environments ensures documentation remains accurate.
Microservices Architecture 🧩
In microservices, each service acts as a process. DFDs help map how data passes between services.
- Service Boundaries: Define clear interfaces.
- API Calls: Represented as data flows.
- Stateless vs. Stateful: Clarify where data stores exist (external services vs. internal databases).
Cloud Integration ☁️
Cloud environments introduce third-party services. DFDs help visualize external dependencies.
- External Entities: Cloud providers (e.g., storage, compute).
- Data Sovereignty: Track where data leaves the organization.
- Security: Identify points where data crosses trust boundaries.
API-First Design 🌐
When designing APIs, DFDs clarify the contract between the consumer and the provider.
- Endpoints: Represented as processes.
- Requests/Responses: Represented as data flows.
- Validation: Show where data is validated before processing.
Best Practices for Creating Effective DFDs 📝
Creating a diagram is not enough; creating a useful one requires adherence to specific standards. Following these guidelines ensures the diagram aids understanding rather than causing confusion.
- Consistent Naming: Use the same name for a data flow across all levels. If “Customer Order” is an input in Level 0, it should appear as “Customer Order” in Level 1.
- Balancing: Ensure inputs and outputs match between parent and child diagrams. If a parent process has an input, the child process must account for it.
- Avoid Control Logic: Do not show if-else statements or loops. DFDs are about data, not control flow.
- Limit Complexity: If a process has more than seven sub-processes, consider breaking it into multiple diagrams.
- Focus on Business Logic: Design from the user’s perspective, not the code’s perspective initially.
Common Pitfalls to Avoid ⚠️
Even experienced analysts make mistakes. Recognizing these errors early saves time during the development phase.
- Ghost Data Flows: Creating arrows that lead nowhere or start nowhere. Every arrow must connect two valid nodes.
- Black Holes: Processes that have input but no output. Data cannot simply disappear.
- Miracles: Processes that have output but no input. Data cannot appear from nowhere.
- External Entity as Data Store: Do not confuse a user (Entity) with a database (Store). Users do not store data permanently.
- Over-Engineering: Trying to model every single database query in a high-level DFD. Keep it at the business function level.
Maintaining DFDs Over Time 🔄
Systems change. Requirements evolve. A DFD that was accurate six months ago may now be obsolete. Maintenance is a critical part of the lifecycle.
- Version Control: Treat diagrams like code. Store them in a repository.
- Change Logs: Document why a change was made to a specific flow.
- Review Cycles: Schedule regular reviews during sprint planning or phase gates.
- Automated Checks: If possible, use tools that validate syntax and connectivity.
Security Considerations 🔒
Security is often an afterthought in system design. DFDs provide a unique opportunity to identify security risks visually.
- Data Classification: Label flows that contain sensitive information (PII, financial data).
- Encryption Points: Identify where data must be encrypted in transit.
- Access Control: Map which entities have access to which data stores.
- Compliance: Use the diagram to demonstrate compliance with regulations like GDPR or HIPAA by showing data retention and deletion paths.
Integration with Agile Methodologies 🚀
Agile development emphasizes iterative progress. DFDs fit well into this framework when used as living documents.
- User Stories: Map DFD processes to user stories.
- Sprint Planning: Review flows to ensure new features do not break existing data paths.
- Documentation: Keep diagrams lightweight to avoid heavy documentation overhead.
- Visual Communication: Use diagrams in stand-ups to clarify data dependencies.
Conclusion on Visualizing Data 🏁
Data Flow Diagrams remain a vital component of system design. They offer a language that bridges the gap between business stakeholders and technical teams. By focusing on the movement of information rather than the mechanics of code, teams can build systems that are robust, secure, and aligned with user needs.
Adopting these practices ensures that the architecture supports the business goals effectively. Whether designing a simple web application or a distributed cloud system, the discipline of mapping data flows provides clarity. Regular updates and adherence to standards prevent the diagram from becoming a relic of the past.
Start with the context, break down the complexity, and verify the balance. This structured approach leads to better systems and fewer surprises during implementation.