

System analysis and design rely heavily on visual communication. When developers, stakeholders, and business analysts discuss how information moves through a system, a Data Flow Diagram (DFD) serves as the universal language. Unlike flowcharts that focus on control logic, DFDs focus on data movement. This guide provides a deep dive into the mechanics, rules, and best practices required to create clear, effective, and maintainable data flow diagrams. We will explore the components, levels, conventions, and common pitfalls to avoid, ensuring your diagrams stand the test of time.
Understanding the Purpose of a DFD 🧭
A Data Flow Diagram is a graphical representation of the flow of data through an information system. It models the system at a logical level, showing what processes transform data, where data is stored, and how it enters or leaves the system. It does not describe the physical implementation, hardware, or timing constraints. Instead, it answers fundamental questions:
- Where does the data come from?
- What happens to the data?
- Where does the data go?
- Where is the data kept?
Clarity in these diagrams reduces ambiguity during development. When a diagram is accurate, it acts as a contract between the business needs and the technical implementation. A well-drawn DFD helps identify missing processes, redundant data stores, or unauthorized data flows before a single line of code is written.
Core Components of a Data Flow Diagram ⚙️
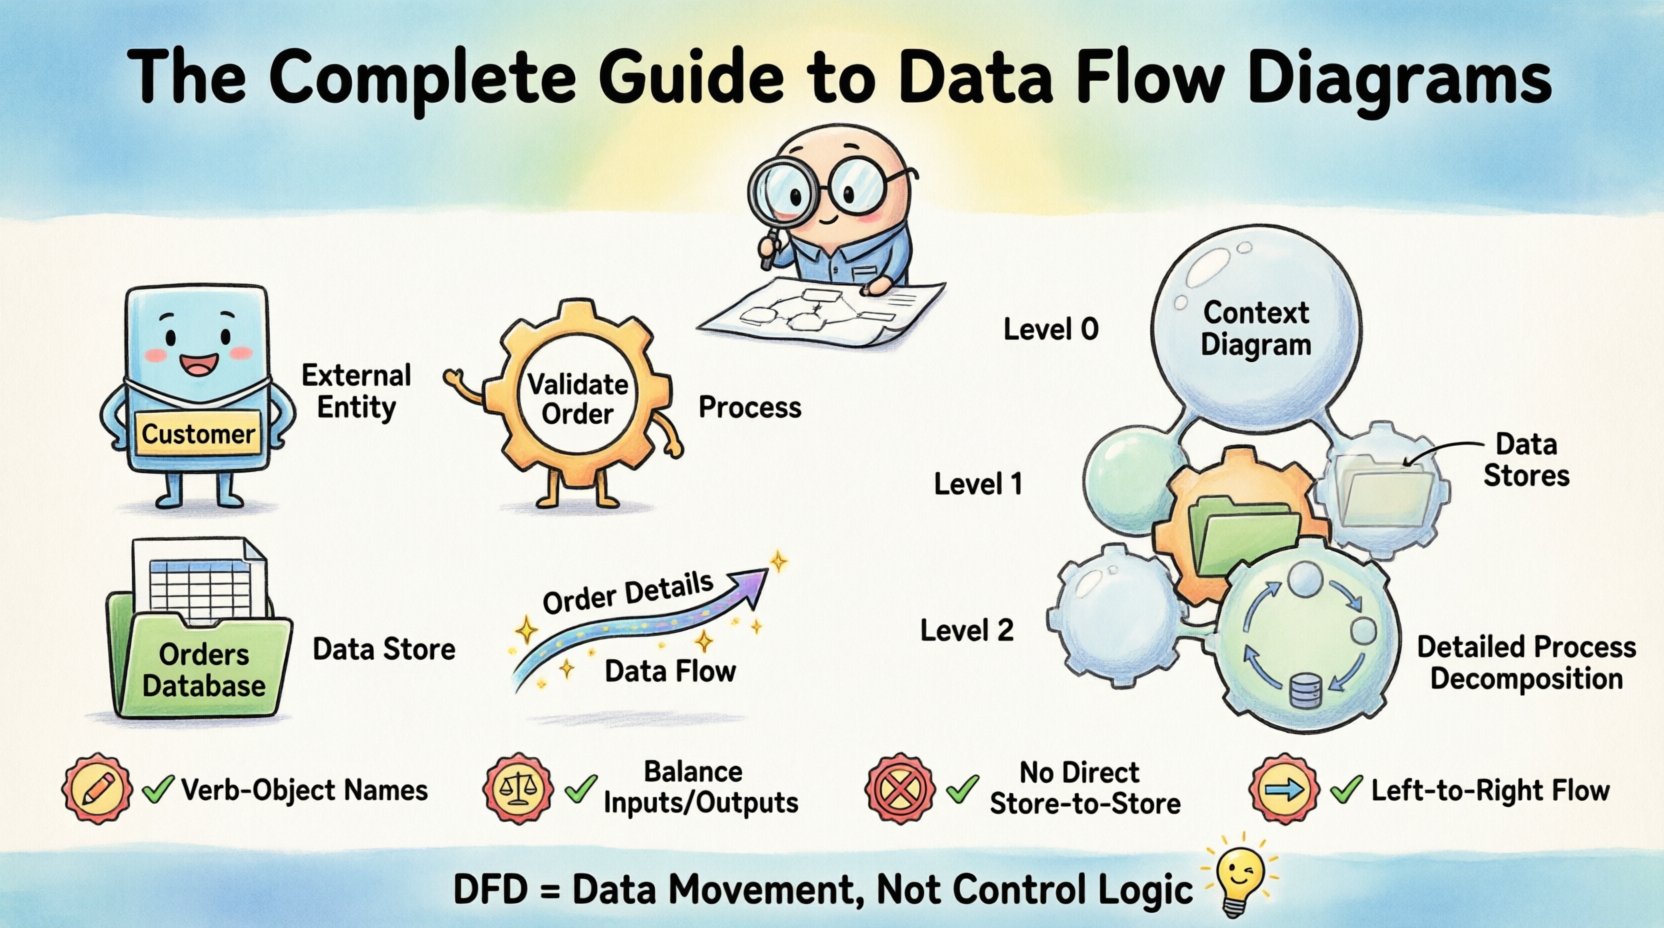
Every DFD, regardless of complexity, is built upon four fundamental symbols. Understanding the distinction between these elements is critical for accurate modeling. Below is a structured overview of these components.
| Component | Symbol Shape | Function | Example |
|---|---|---|---|
| External Entity | Rectangle or Square | Source or Destination of data outside the system boundary. | Customer, Supplier, Bank, Government Agency. |
| Process | Circle or Rounded Rectangle | Transforms incoming data into outgoing data. It must have an action verb. | Calculate Tax, Validate Order, Generate Report. |
| Data Store | Open Rectangle or Parallel Lines | Passive repository where data rests at rest. Not a flow. | Customer Database, Order Log, Inventory File. |
| Data Flow | Arrow | Shows the movement of data between entities, processes, and stores. | Order Details, Payment Receipt, Login Credentials. |
External Entities represent people, organizations, or other systems that interact with the system being modeled. They are the boundaries of your analysis. Processes are the active elements. They change the state of data. A process cannot exist without data flowing in and out. Data Stores are passive. Data sits there until a process retrieves or writes to it. Data Flows are the connectors. They carry the payload of information.
Levels of Data Flow Diagrams 📉
DFDs are hierarchical. You do not draw the entire system on one page. Decomposition allows you to manage complexity. There are three primary levels of DFDs.
1. Context Diagram (Level 0)
The Context Diagram is the highest level view. It shows the system as a single process bubble. It identifies all external entities and the major data flows entering and leaving the system. This diagram provides a high-level overview for stakeholders who do not need to see internal details. It defines the scope of the project.
- One Process Only: The entire system is represented by one circle.
- External Entities: All sources and destinations are shown.
- No Data Stores: Typically, internal storage is hidden at this level.
2. Level 1 Diagram
The Level 1 diagram breaks down the single process from the Context Diagram into major sub-processes. It reveals the internal workings of the system while maintaining the same external entities. This is where the primary business logic is mapped.
- Multiple Processes: Usually between 3 to 9 processes for clarity.
- Data Stores Appear: Internal repositories are introduced.
- Consistency: Inputs and outputs must match the Context Diagram exactly.
3. Level 2 and Below (Decomposition)
Level 2 diagrams decompose specific processes from Level 1. This continues until the processes are simple enough to be implemented directly. If a process becomes too complex to understand, it needs further decomposition.
- Focus: Detailed logic for a specific function.
- Termination: Stop when the process describes a single task or a clear database query.
- Child Diagrams: Each Level 1 process can have its own child diagram.
Essential Rules and Conventions 📏
To ensure your DFDs are technically sound and readable, you must adhere to specific conventions. Violating these rules creates confusion and leads to design errors.
1. Naming Conventions
Labels on your diagram are the text that explains the visual elements. Poor naming makes a diagram useless.
- Processes: Use a Verb-Object phrase. For example, “Validate Login” is better than “Login”. This emphasizes action.
- Data Flows: Use Noun phrases. For example, “User Credentials” is better than “Login”. This emphasizes the data content.
- Data Stores: Use plural nouns representing the content. For example, “Orders” or “User Accounts”.
- External Entities: Use singular nouns representing the source. For example, “Customer” or “Manager”.
2. The Balancing Rule
Balancing is the most critical rule for maintaining consistency across levels. The inputs and outputs of a parent process must exactly match the inputs and outputs of its child diagram.
- Check List: If a Level 1 process receives “Payment Data”, every child diagram within that process must receive “Payment Data” at least once.
- Ghost Flows: Ensure no data flow disappears or appears magically. Every flow must be accounted for.
- Validation: Always compare the parent diagram against the child diagram before finalizing.
3. Numbering System
A logical numbering scheme helps track the hierarchy of your diagrams. This is essential for large systems with many sub-processes.
- Root Process: Process 1 (in Context Diagram).
- Level 1: Processes 1.1, 1.2, 1.3.
- Level 2: Processes 1.1.1, 1.1.2, 1.1.3.
- Format: Use dots to separate levels. This prevents confusion when adding new processes later.
4. Data Flow Restrictions
There are specific restrictions on how data can move between components.
- No Flow to Flow: Data cannot move directly from one flow line to another. It must go through a process.
- No Store to Store: Data cannot move directly from one Data Store to another. A process must mediate the transfer.
- No Entity to Entity: Data cannot bypass the system to move directly from one External Entity to another.
- No Process to Process without Flow: Processes must be connected by a Data Flow arrow.
Step-by-Step Process for Drawing a DFD 🛠️
Creating a Data Flow Diagram is a structured activity. Follow these steps to ensure a logical progression from concept to final diagram.
- Identify External Entities: List all users, systems, or organizations that interact with the system. Do not include internal staff unless they are the primary interface.
- Draw the Context Diagram: Place the system in the center as one process. Draw arrows to and from all external entities. Label the flows clearly.
- Decompose the Main Process: Break the central process into major sub-processes. Identify the primary data stores needed to support these processes.
- Create Level 1 Diagram: Draw the new processes and stores. Ensure all data flows connect correctly. Verify that the inputs and outputs match the Context Diagram.
- Refine and Number: Apply your numbering scheme. Check for naming consistency.
- Decompose Further: Select complex processes from Level 1 and create Level 2 diagrams. Repeat until the logic is clear.
- Validate Balancing: Review all child diagrams against their parents. Check for missing flows or extra flows.
- Review with Stakeholders: Walk through the diagrams with business users. Confirm that the logic matches their understanding of the business rules.
Common Mistakes to Avoid ⚠️
Even experienced analysts make mistakes. Being aware of common pitfalls will save you time during the review phase.
- Control Logic in DFD: Avoid showing “If/Else” logic or loops. DFDs show data movement, not control flow. If you need to show logic, use a decision table or pseudocode instead.
- Missing Data Flows: It is common to forget a flow returning to a Data Store. Always check if a process writes to a store and reads from it.
- Black Holes: A process with only inputs and no outputs. Data enters but never leaves. This implies data is lost or the process is incomplete.
- Miracles: A process with only outputs and no inputs. Data appears out of nowhere. This implies the process is generating data without a source.
- Overcrowding: If a diagram has more than 10 processes, it is likely too complex. Decompose it further.
- Criss-Crossing Lines: While not strictly forbidden, crossing lines make diagrams hard to read. Use orthogonal routing (90-degree angles) to keep the layout clean.
- Confusing Data Store with File: A Data Store is a logical concept. Do not label it “Hard Drive C:”. Label it “Backup Log”.
DFD vs Other Diagramming Techniques 🔄
It is important to know when to use a DFD and when to choose a different diagram type. Each tool serves a specific purpose in system modeling.
| Diagram Type | Focus | When to Use |
|---|---|---|
| Data Flow Diagram | Data movement and transformation. | System requirements, logical design, process analysis. |
| Entity Relationship Diagram (ERD) | Data structure and relationships. | Database design, schema definition, data integrity. |
| Flowchart | Control flow and decision logic. | Algorithm design, user interface logic, conditional paths. |
| Use Case Diagram | Actor interactions and functionality. | Functional requirements, user goals, system features. |
DFDs complement ERDs. While DFDs show how data moves, ERDs show how data is structured. Use them together for a complete picture of the system.
Best Practices for Layout and Readability 🎨
A technically correct diagram that is hard to read fails its purpose. Visual design plays a significant role in communication.
- Consistent Spacing: Keep equal distances between processes and stores. This creates a rhythm that is easy to follow.
- Logical Grouping: Group related processes together. For example, all “Order Processing” functions should be clustered.
- Directional Flow: Arrange diagrams to flow from left to right or top to bottom. Avoid reversing direction unnecessarily.
- Label Clarity: Keep text concise. If a label is too long, use an annotation or a separate legend.
- Color Usage: Use color sparingly to highlight specific elements, such as external entities or critical data stores. Do not rely on color alone for meaning.
- Documentation: Always include a legend if you use non-standard symbols. Document the data dictionary definitions for all data flows.
The Role of DFDs in Modern Development 🚀
In modern software engineering, the role of DFDs has evolved. While some agile methodologies prefer lightweight documentation, the logical clarity of a DFD remains valuable.
- Microservices: DFDs help map data boundaries between microservices. They define the contract for API communication.
- Legacy Modernization: When analyzing old systems, DFDs help map the existing data movement before refactoring.
- Security Audits: DFDs are excellent for identifying where sensitive data flows. This helps in applying encryption and access controls.
- API Design: Before writing OpenAPI specifications, a DFD helps define the input and output payloads for each endpoint.
Summary of Key Takeaways ✅
Creating effective Data Flow Diagrams requires a balance between technical accuracy and visual clarity. By understanding the four core components, adhering to the balancing rule, and following strict naming conventions, you can produce diagrams that serve as reliable blueprints for system development. Remember that a DFD is a living document. It should evolve as the system requirements change.
Focus on the movement of data, not the control logic. Ensure every process has a source and a destination. Keep your diagrams decomposed to manageable sizes. Finally, validate your work with stakeholders to ensure the model reflects reality. With these principles in mind, you can construct data flow diagrams that enhance communication and reduce development risk.
Use these guidelines as a foundation for your next system analysis project. Clear diagrams lead to clear code, and clear code leads to stable systems. Start drawing with precision today.