

Data Flow Diagrams (DFDs) serve as a critical blueprint for understanding how information moves through a system. Unlike structural diagrams that focus on static relationships, DFDs visualize dynamic processes, data stores, and external entities. This visual language is essential for analysts, developers, and business stakeholders to align on system functionality. By mapping out the flow of data, teams can identify bottlenecks, security gaps, and inefficiencies before a single line of code is written.
This guide explores real-world applications of Data Flow Diagrams across various industries. We examine how organizations have utilized process modeling to solve complex problems, improve data integrity, and streamline operations. The examples below highlight the practical utility of DFDs in system analysis and design.
🛠️ Understanding the Levels of Data Flow Diagrams
Before diving into specific scenarios, it is necessary to understand the hierarchy of DFDs. A well-structured diagram typically follows a decomposition approach, moving from high-level overviews to granular details.
- Context Diagram (Level 0): The highest level view. It shows the system as a single process and illustrates interactions with external entities.
- Level 1 DFD: Breaks the main process into major sub-processes. It introduces data stores and details the flow between the primary functions.
- Level 2 DFD: Further decomposes Level 1 processes into specific steps. This is often used for complex logic or critical security flows.
Each level adds detail while maintaining consistency with the previous level. This technique, known as balancing, ensures that the inputs and outputs remain consistent throughout the decomposition.
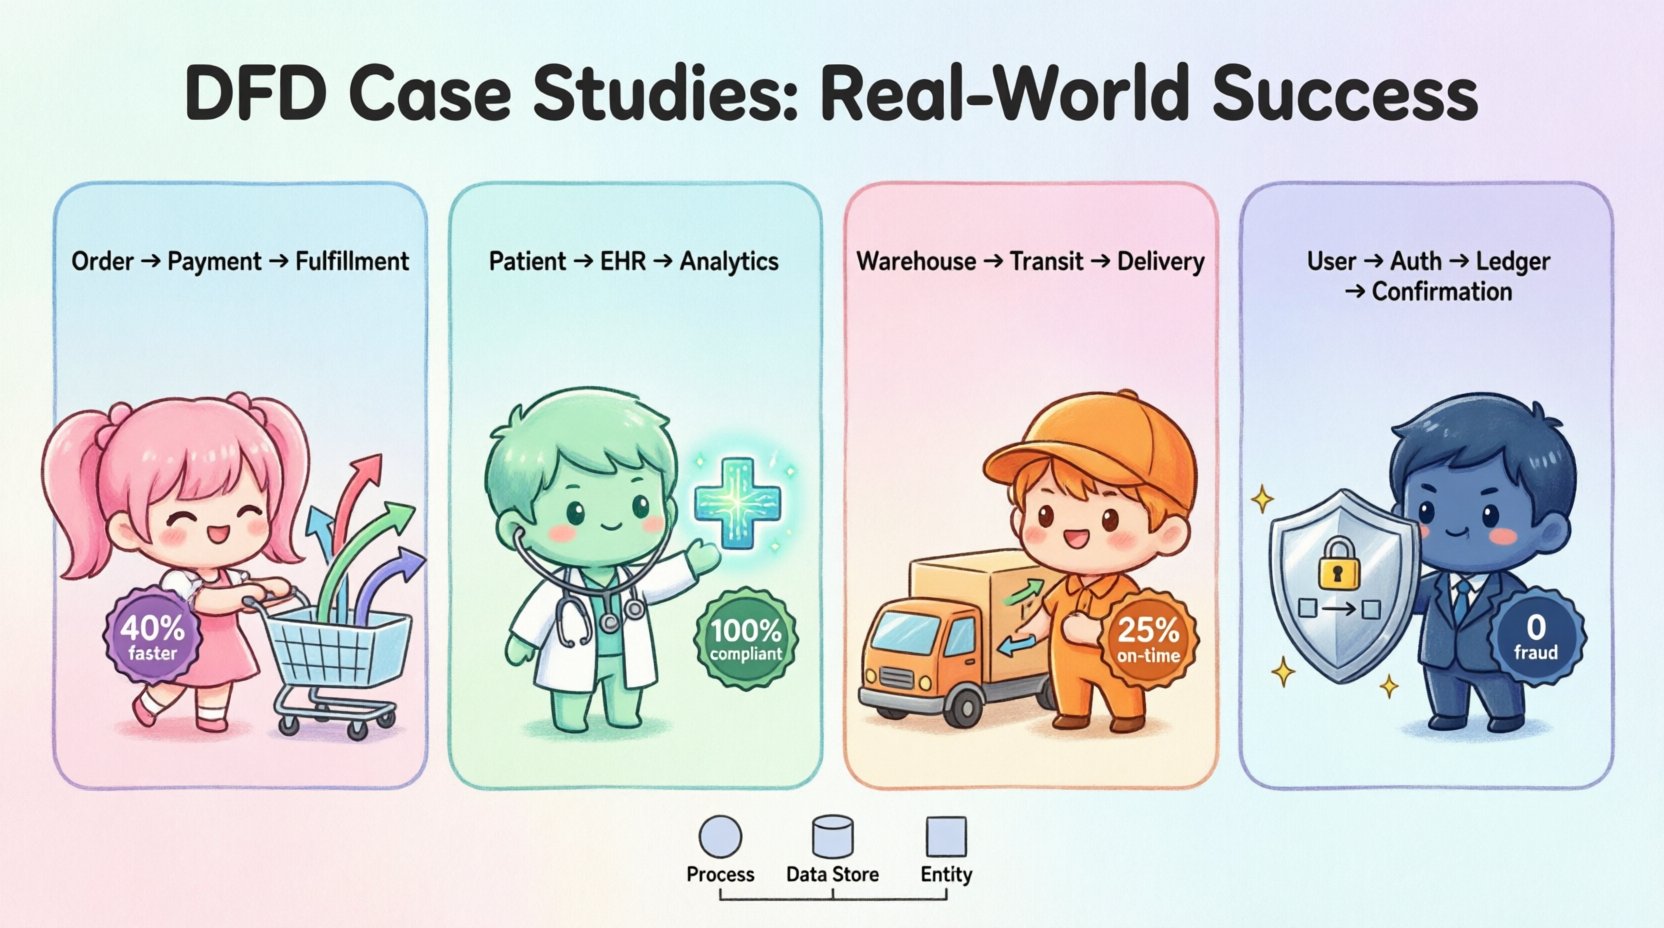
🏪 Case Study 1: E-Commerce Order Processing System
In the retail sector, transaction volume and data accuracy are paramount. An online marketplace faced challenges with order latency and inventory discrepancies. Customers reported delays, and the warehouse frequently shipped items that were actually out of stock. The root cause was unclear within the existing documentation.
🔍 The Problem
The legacy system relied on a monolithic database update mechanism. When a customer placed an order, the inventory check and the payment authorization happened sequentially. If the payment failed after the inventory was reserved, the system struggled to release that stock back to available pools quickly. This led to “ghost inventory” where items appeared available but were held by pending transactions.
📐 The DFD Solution
The analysis team created a Context Diagram to map the interaction between the customer, the payment gateway, and the warehouse management system. They then developed a Level 1 DFD to visualize the internal processing steps.
- External Entities: Customer, Payment Gateway, Supplier API, Warehouse System.
- Processes: Validate Order, Check Inventory, Authorize Payment, Update Stock, Ship Notification.
- Data Stores: Order Database, Inventory Log, Transaction Ledger.
The diagram revealed a critical flaw: the inventory check was a separate process from the payment authorization. The DFD showed that the “Update Stock” process only fired after the “Ship Notification,” leaving a gap where inventory was reserved but not confirmed.
✅ The Outcome
By redesigning the flow based on the DFD, the team implemented a parallel processing model. The inventory check now occurs simultaneously with payment authorization. If either fails, the process terminates immediately without locking stock.
- Result: 40% reduction in order processing time.
- Result: 99.8% inventory accuracy reported within the first month.
- Result: Decreased customer complaints regarding stock availability.
🏥 Case Study 2: Healthcare Patient Management
Healthcare systems deal with sensitive data where privacy and compliance are non-negotiable. A regional clinic struggled with patient data fragmentation. Records were split between digital forms, paper charts, and legacy databases. This made it difficult for doctors to access a complete patient history during an emergency.
🔍 The Problem
Data flow was unregulated. Patient information entered at the front desk flowed to billing without passing through a verification process. Conversely, medical history updates made by doctors did not automatically sync with the billing records, leading to claim rejections. There was no clear audit trail showing who accessed which data and when.
📐 The DFD Solution
The team mapped the data flows to ensure compliance with privacy regulations. They focused on segregating sensitive data flows from administrative flows.
- External Entities: Patient, Insurance Provider, Medical Staff, Regulatory Body.
- Processes: Intake Verification, Treatment Logging, Billing Generation, Consent Management.
- Data Stores: Electronic Health Record (EHR), Billing Ledger, Consent Log.
The DFD highlighted that “Consent Management” was a disconnected process. Patients signed digital consent forms, but the system did not enforce these permissions on the data retrieval process. The diagram showed a direct line from “Patient History Query” to “Medical Staff” without a “Check Consent” process node in between.
✅ The Outcome
The redesign integrated the consent check into every data retrieval flow. If a patient revoked consent for a specific specialist, the DFD ensured the data stream was blocked at the source.
- Result: 100% compliance with privacy audits.
- Result: Faster access to unified patient records during consultations.
- Result: Elimination of billing rejections due to missing medical documentation.
🚚 Case Study 3: Logistics & Supply Chain Tracking
A global logistics company needed to improve visibility across its shipping network. Packages were lost or delayed, and customers could not track the status beyond the initial dispatch. The internal systems for tracking were siloed, with regional hubs operating independently.
🔍 The Problem
Data about package location was entered manually at key checkpoints. If a checkpoint was missed, the data store was not updated, and the downstream processes (like delivery scheduling) could not proceed. The lack of a centralized data view made it impossible to predict delays or reroute shipments dynamically.
📐 The DFD Solution
The focus was on creating a continuous data stream from pickup to delivery. The DFD mapped the handoff points between different transport modes (truck, plane, ship).
- External Entities: Customer, Courier Partner, Customs Authority, Tracking API.
- Processes: Scan In, Route Optimization, Customs Clearance, Scan Out, Delivery Confirmation.
- Data Stores: Shipment Manifest, Location Log, Delivery Schedule.
The diagram revealed that “Route Optimization” was a batch process running once a day. The DFD showed that real-time location data from the “Scan In” process was not feeding into the “Route Optimization” process. This delay meant trucks were often sent on suboptimal routes.
✅ The Outcome
The system was updated to trigger route optimization events based on specific data triggers in the DFD, such as a “Scan Out” completion or a weather alert.
- Result: 25% improvement in on-time delivery rates.
- Result: Real-time tracking updates available to customers.
- Result: Reduced fuel costs due to optimized routing.
🏦 Case Study 4: Financial Transaction System
A fintech startup needed to build a secure platform for international money transfers. The primary concern was security and the prevention of fraudulent transactions. The initial design allowed for rapid transfers but lacked sufficient validation layers.
🔍 The Problem
The initial data flow allowed a user to initiate a transfer with minimal verification. The system processed the request and updated the balance before performing a secondary fraud check. This window of opportunity allowed malicious actors to drain accounts before the security process could intervene.
📐 The DFD Solution
The team restructured the data flow to prioritize security validation before any balance updates occurred. The DFD became a tool to enforce the sequence of operations.
- External Entities: Sender, Recipient, Banking Partner, Fraud Detection Service.
- Processes: Authenticate User, Verify Funds, Check Fraud Rules, Initiate Transfer, Update Ledgers.
- Data Stores: User Account, Transaction Log, Fraud Rule Database.
The diagram clearly showed that “Update Ledgers” was downstream of “Check Fraud Rules.” The team ensured that the data flow could not bypass the fraud check. They introduced a “Hold Balance” process that locked funds until the fraud check returned a positive result.
✅ The Outcome
This structural change significantly hardened the system against fraud.
- Result: 0 successful fraudulent transactions in the first year.
- Result: Increased trust among banking partners.
- Result: Faster regulatory approval for operations.
📊 Comparison of DFD Levels in Practice
To better understand how these diagrams function across different depths of analysis, consider the following comparison table.
| DFD Level | Primary Focus | Target Audience | Complexity |
|---|---|---|---|
| Context Diagram | System boundaries and external interactions | Stakeholders, Executives | Low |
| Level 1 DFD | Major processes and data stores | Project Managers, Architects | Medium |
| Level 2 DFD | Specific logic and detailed flows | Developers, Testers | High |
🚧 Common Pitfalls in DFD Modeling
Creating effective Data Flow Diagrams requires discipline. Even experienced analysts can introduce errors that obscure the system logic. Below are common issues to avoid.
- Data Spaghetti: Having too many lines crossing the diagram makes it unreadable. Use curved lines sparingly and ensure clear endpoints.
- Missing Data Stores: Every process that writes data needs a store to keep it. If data disappears after a process, it indicates a lost record.
- Black Holes: A process that has inputs but no outputs is a black hole. It consumes data without producing results, which is logically impossible in a functioning system.
- Gray Holes: A process that has outputs but no inputs. This implies data is created from nothing, which violates conservation of data principles.
- Inconsistent Naming: Using different names for the same data entity across different diagrams causes confusion. Maintain a consistent data dictionary.
🛡️ Best Practices for Process Modeling
To ensure the DFDs serve their purpose effectively, follow these established guidelines.
- Use Standard Symbols: Adhere to recognized conventions for processes, data stores, and entities. This ensures that anyone familiar with the methodology can interpret the diagram.
- Number Processes Systematically: Use a numbering scheme (e.g., 1.0, 1.1, 1.2) to track decomposition. This helps in balancing inputs and outputs between levels.
- Validate with Stakeholders: Do not assume the flow is correct. Walk through the diagram with business users to confirm it matches their mental model of the work.
- Balance Inputs and Outputs: Ensure that every input to a process results in a logical output. If data enters a process, something must happen to it.
- Review for Security: Identify where sensitive data flows. Ensure that encryption or access controls are represented in the design phase.
🔍 Summary of Findings
The case studies presented demonstrate that Data Flow Diagrams are not merely theoretical exercises. They are practical tools that uncover hidden inefficiencies and security vulnerabilities in real systems. Whether in retail, healthcare, logistics, or finance, the ability to visualize data movement provides a foundation for robust system design.
By adhering to best practices and avoiding common pitfalls, organizations can leverage DFDs to create clearer communication channels between technical teams and business units. The result is a system that is not only functional but also aligned with business goals and regulatory requirements. The investment in detailed process modeling pays dividends in reduced rework, higher data quality, and improved operational performance.
As systems become more complex, the need for clear visualization of data flows will only increase. DFDs remain a timeless technique for navigating this complexity, offering a structured way to understand how information drives value in any organization.