

Modern infrastructure operates at a scale that defies intuition. Systems span multiple environments, integrate disparate services, and process vast quantities of information every second. When something breaks, the noise is deafening. Logs flood dashboards, alerts cascade, and the root cause remains obscured by layers of abstraction. To navigate this complexity, engineers require a method to visualize the invisible. This is where Data Flow Analysis comes into play.
Understanding how information moves through a system is not merely an academic exercise; it is the bedrock of effective troubleshooting. By mapping the journey of data from inception to termination, you gain a vantage point that reveals bottlenecks, dead ends, and corruption points before they become critical failures. This guide outlines a strategic approach to diagnosing system health using Data Flow Diagrams (DFD) and analytical rigor.
🧩 The Foundation: What is Data Flow Analysis?
Data Flow Analysis is the practice of tracking the movement of data across a system. Unlike code walkthroughs that focus on logic execution, data flow focuses on the lifecycle of information. It answers specific questions: Where does this data originate? How is it transformed? Where does it reside? Who consumes it? And crucially, where does it go when things go wrong?
In a complex environment, data is rarely static. It is transformed by processes, stored in repositories, and transmitted between external entities. A failure in one node often manifests symptoms in a completely different part of the architecture. Without a map, troubleshooting becomes a game of chance. With a map, it becomes a structured investigation.
Core Components of a Data Flow Diagram
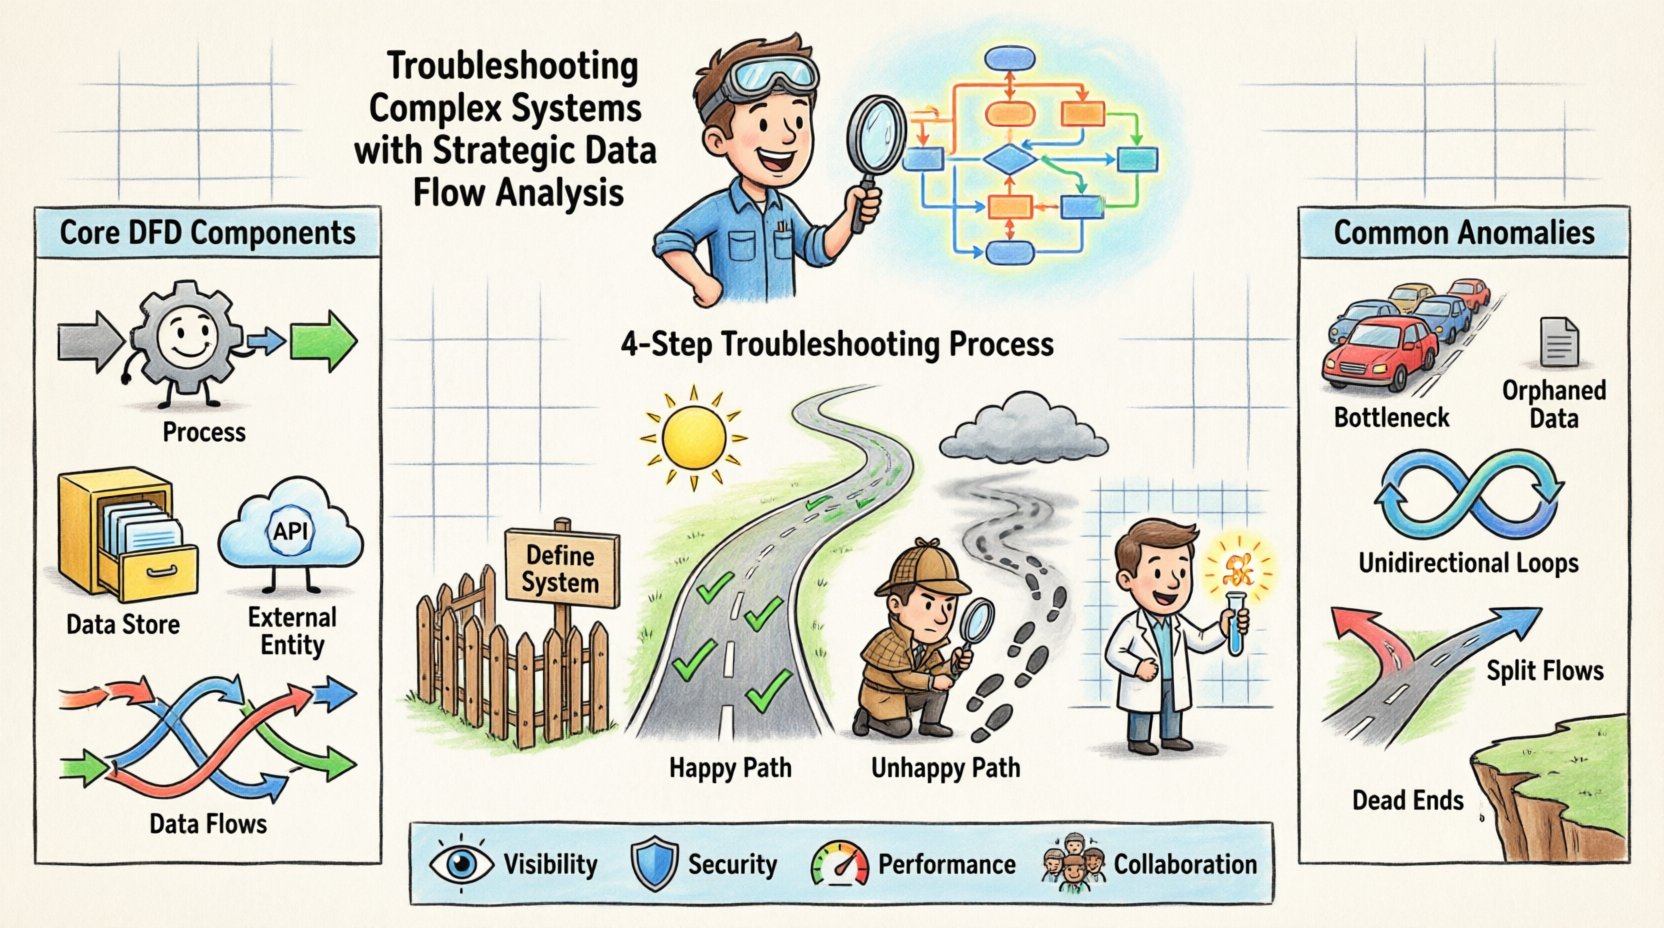
To execute a strategic analysis, you must understand the building blocks of the visualization. Every valid diagram relies on four fundamental elements:
- Processes: Transformations that convert input data into output data. These are the active agents of change.
- Data Stores: Repositories where information rests between processes. This includes databases, file systems, and caches.
- External Entities: Sources or destinations outside the immediate system boundary. Users, third-party APIs, and legacy systems fall here.
- Data Flows: The arrows indicating the movement of information. These represent the network traffic, queues, or message passing mechanisms.
When troubleshooting, you do not need to draw every single byte. You need to identify the critical paths that dictate system behavior. Focusing on high-level flows allows you to isolate the layer where the anomaly occurs.
🔍 Why Data Flow Matters in Troubleshooting
Traditional debugging often relies on reactive measures. An error occurs, a stack trace is examined, and patches are applied. This works for simple, linear issues. However, in distributed architectures, symptoms are often decoupled from causes. A database timeout might be caused by a network latency issue in a completely different region. A UI freeze might be the result of a background process consuming all available memory.
Data Flow Analysis shifts the paradigm from reactive to proactive. It provides a holistic view that connects symptoms to their upstream origins. Here is why this approach is essential for complex environments:
- Visibility into Hidden Dependencies: You often cannot see the connections that matter most until you map them. A seemingly isolated service might rely on a shared queue that is saturated.
- Identification of Single Points of Failure: By tracing the flow, you can identify nodes where all paths converge. If that node fails, the entire system halts.
- Performance Bottleneck Detection: Data flow maps reveal where data accumulates. If a process is slower than the previous one, a queue will build up, indicating a processing bottleneck.
- Security and Compliance Auditing: Tracking where sensitive data flows ensures it is encrypted and stored according to policy. Troubleshooting security incidents requires knowing the exact path of the compromised data.
📝 The Strategic Analysis Process
Executing a data flow analysis is not a one-time event. It is a disciplined process that requires preparation, execution, and verification. The following steps outline a robust methodology for applying this strategy to a live or failing system.
Step 1: Define the System Boundary
Before drawing lines, define what is inside the system and what is outside. This is critical because data flows crossing the boundary often involve authentication, serialization, or protocol conversion. If you include too much external context, the diagram becomes cluttered. If you include too little, you miss the root cause.
Key Actions:
- Identify the primary user or system triggering the issue.
- List the internal components responsible for handling that request.
- Mark external dependencies clearly (e.g., “External Payment Gateway”).
Step 2: Map the Happy Path
Start with the ideal scenario. How does data move when everything works correctly? This establishes the baseline. You cannot identify an anomaly without knowing what normal flow looks like.
Key Actions:
- Document the sequence of processes from input to output.
- Note the data structures at each stage (e.g., JSON, XML, Binary).
- Record the expected latency and throughput at each stage.
Step 3: Trace the Unhappy Path
Now, trace the specific error path. Where did the data go when it failed? Did it get stuck? Did it get dropped? Did it get transformed incorrectly? This often involves replaying logs or using tracing tools to follow a specific transaction ID through the mapped flows.
Key Actions:
- Locate the first deviation from the Happy Path.
- Identify the process responsible for the deviation.
- Check the data store associated with that process for state anomalies.
Step 4: Isolate the Variable
Once the deviation is found, isolate the variable. Is it the data itself? Is it the process logic? Is it the infrastructure? Use the diagram to mentally disconnect components. If you bypass Process A, does the error persist? If you replace the Data Store, does it resolve?
🚦 Common Anomalies and Patterns
Certain patterns repeat across complex systems. Recognizing these patterns speeds up the analysis significantly. The table below outlines common data flow anomalies and their typical characteristics.
| Anomaly Type | Description | Common Symptoms | Investigation Focus |
|---|---|---|---|
| Data Bottleneck | Data enters a process faster than it can be processed. | Increasing queue depth, rising latency, timeout errors. | Process throughput capacity vs. input rate. |
| Orphaned Data | Data is stored but no process reads or updates it. | Disk space growth, stale records, backup failures. | Data Stores and their consumer processes. |
| Unidirectional Loops | Data flows in a cycle without termination. | Infinite loops, stack overflow, CPU saturation. | Process logic and termination conditions. |
| Split Flows | Data is sent to multiple destinations inconsistently. | Inconsistent state across services, race conditions. | Routing logic and message distribution. |
| Dead Ends | Data reaches a process but never exits. | Request hanging, no response returned to user. | Process exit paths and error handling. |
🧪 Advanced Techniques for Deep Dives
When standard mapping fails to reveal the issue, deeper analytical techniques are required. These methods involve breaking down the diagram further or looking at data in motion.
Context Level Decomposition
A high-level DFD might show a single process labeled “Order Processing.” To troubleshoot, you must decompose this into its sub-processes. Does the order validation happen before or after inventory check? Is the inventory check synchronous or asynchronous? Decomposition reveals the internal logic that might be causing the delay or failure.
Data Dictionary Alignment
A map is only as good as the definitions of the data it carries. Ensure that the data schema matches the flow definitions. A common issue is a schema mismatch where the sender transmits a field the receiver expects in a different format. This leads to parsing errors that halt the flow. Aligning the data dictionary with the flow diagram helps spot these mismatches early.
Concurrency and State Analysis
Data flow diagrams often imply sequential movement, but modern systems are highly concurrent. Multiple instances of a process might be working on the same data store simultaneously. This introduces race conditions. When troubleshooting, consider the state of the data store. Is the lock being held too long? Is a transaction rolling back unexpectedly? The flow diagram must be annotated with concurrency constraints to be truly effective.
🤝 Collaboration and Documentation
A data flow analysis is rarely a solo effort. It requires input from architects, developers, and operations teams. The documentation generated from this analysis becomes the source of truth for the system’s behavior.
- Version Control: Diagrams change as systems evolve. Treat them as code. Store them in version control systems. This allows you to compare the current state against historical states to see how the architecture drifted.
- Review Cycles: Have peers review the flow diagrams. Someone else might spot a dependency you missed. A fresh pair of eyes often catches logical gaps in the flow.
- Living Documents: Do not create a diagram and file it away. Update it whenever a change is deployed. If the diagram is outdated, it is not a map; it is a relic.
🛡️ Security Implications in Data Flow
Security is an inherent part of data flow. When troubleshooting performance or stability issues, security controls can sometimes be the culprit. Encryption, decryption, and token validation add latency. If a token is invalid, the flow stops. If encryption keys are rotated, the flow breaks.
When analyzing a flow, explicitly mark security boundaries. Where does data leave the trusted zone? Where does authentication occur? If a flow is interrupted, check the security layer first. A firewall rule change or an expired certificate can look exactly like a software bug.
Key Security Flow Checks
- Verify that sensitive data is not being logged in plaintext at any node.
- Ensure that data stores are not accessible from unauthorized processes.
- Check that all external entities are authenticated before data is accepted.
- Confirm that data is encrypted in transit between all processes.
🔄 Maintenance and Iteration
Once the issue is resolved, the analysis must be updated. The fix itself changes the flow. Perhaps a new cache was added, or a database was sharded. These changes alter the data paths. Documenting the resolution ensures that future troubleshooting efforts start from the corrected state.
Furthermore, regular audits of the data flow are beneficial. Schedule reviews where the team walks through the diagram without a specific incident. This “clean room” review helps identify technical debt. You might find a process that is rarely used but still consuming resources, or a data store that has grown without purpose.
📈 Measuring Success
How do you know this approach is working? You measure it through operational metrics and qualitative feedback. Over time, you should see a reduction in Mean Time to Resolution (MTTR). The more you understand the flow, the faster you can trace an issue.
Look for improvements in:
- Incident Duration: Are outages resolved faster?
- Root Cause Clarity: Is the explanation for failures more precise?
- Communication: Is it easier to explain system behavior to stakeholders?
- Change Impact: Are you better able to predict how a change will affect the system?
🧠 The Human Element
Finally, remember that data flows are created and managed by people. The complexity often stems from organizational complexity as much as technical complexity. Silos between teams can lead to data flows that no single person fully understands. A strategic analysis forces collaboration. It brings people together to look at the same map.
Use the diagram as a conversation starter. Walk your team through the flow. Ask them where they think the pain points are. Often, the answer lies in the collective experience of the engineers who maintain the system. The diagram provides the structure, but the team provides the insight.
🔧 Conclusion
Troubleshooting complex systems requires more than just checking logs. It requires a structural understanding of how information moves. Data Flow Analysis provides that structure. It transforms a chaotic environment into a navigable landscape. By mapping the happy path, tracing the unhappy path, and isolating variables, you can diagnose issues with precision.
This is not a one-time fix. It is a continuous practice. As systems grow, so does the need for clarity. Invest time in maintaining your data flow diagrams. Keep them accurate. Keep them visible. When the next critical failure occurs, you will be ready to find the path forward.