

Understanding how data moves through a system is fundamental to effective software architecture. Data Flow Diagrams (DFDs) serve as the visual blueprints for these complex interactions. Over the decades, the techniques used to map these flows have evolved significantly. This guide provides a deep dive into the distinctions between traditional and modern DFD methodologies, exploring their structures, applications, and implications for system design.
Whether you are designing a legacy mainframe system or a cloud-native microservice architecture, grasping these differences ensures that your documentation remains accurate and useful. We will examine the theoretical foundations, practical implementations, and the shifting landscape of system modeling.
🏗️ Foundations of the Data Flow Diagram
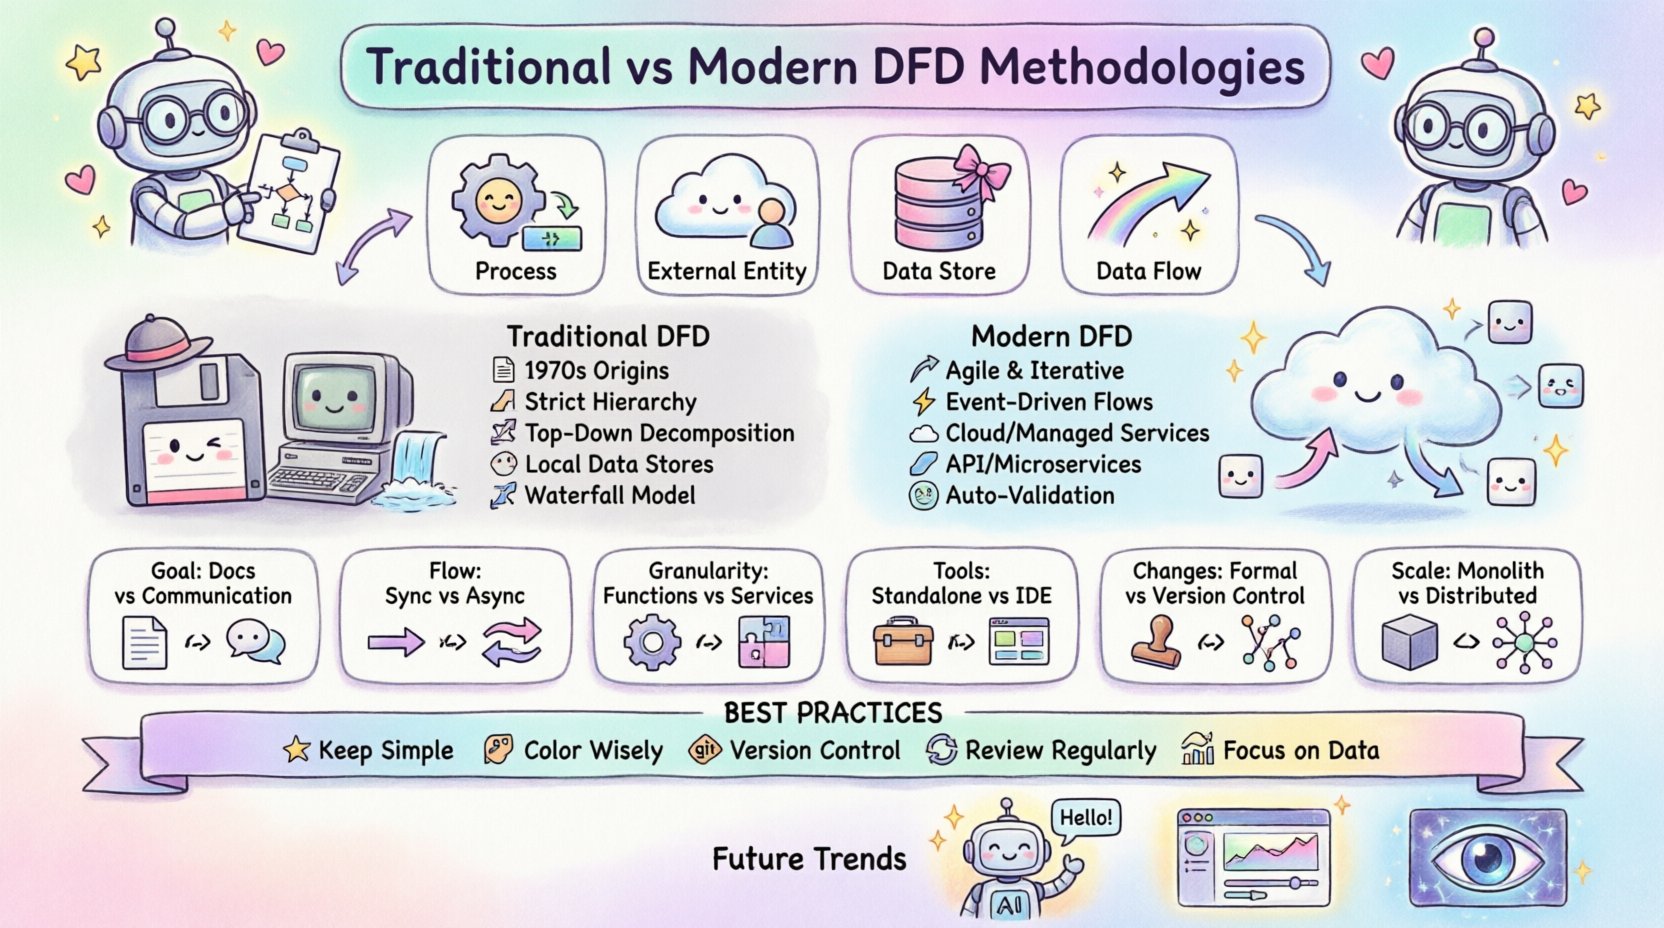
A Data Flow Diagram is a graphical representation of the flow of data through an information system. Unlike flowcharts, which focus on control flow and logic, DFDs focus on the movement of data from external sources to internal processes and finally to destinations. The core components remain consistent regardless of the methodology used:
- Processes: Actions that transform input data into output data.
- External Entities: Sources or destinations of data outside the system boundary.
- Data Stores: Where data is held for later use.
- Data Flows: The movement of data between the above components.
The way these components are named, connected, and decomposed defines the specific methodology employed. Traditional approaches prioritize strict hierarchy and documentation, while modern approaches prioritize flexibility and integration with development lifecycles.
📜 The Traditional DFD Approach
Traditional Data Flow Diagrams emerged in the 1970s. The two primary schools of thought were the Yourdon and DeMarco notation and the Gane and Sarson notation. Both share a roots in structured analysis and systems engineering.
1. Structured Analysis and Design
In the traditional context, the DFD is a static artifact created during the requirements phase. The goal is to define the system boundaries clearly before writing a single line of code. This methodology assumes that requirements are stable and can be fully understood upfront.
- Top-Down Decomposition: The system starts with a Context Diagram (Level 0) showing the system as a single process. This is then broken down into Level 1, Level 2, and so on.
- Strict Hierarchy: Every input to a process must have a corresponding output. This prevents “black holes” (inputs with no output) and “miracles” (outputs with no input).
- Data Stores as Files: Data stores typically represented disk files or database tables that are persistent and accessed sequentially or via keys.
2. Notation Differences
While the concepts are similar, the visual representation differs between the two main traditional schools:
- Yourdon/DeMarco: Uses circles for processes, open-ended rectangles for data stores, and arrows for data flows.
- Gane/Sarson: Uses rounded rectangles for processes, a rectangle with the right side open for data stores, and arrows for data flows.
3. The Waterfall Connection
Traditional DFDs align closely with the Waterfall model. The diagram is created, reviewed, signed off, and then handed to developers. Changes are difficult to incorporate once the development phase begins. This rigidity was necessary in an era where coding was expensive and time-consuming.
🚀 The Modern DFD Methodology
Modern system design has shifted towards agility, continuous delivery, and distributed computing. The rigid structures of the 1970s do not always map well to microservices, real-time APIs, and event-driven architectures. Modern DFD methodologies adapt to these realities.
1. Dynamic Requirements
Modern projects often utilize Agile frameworks. Requirements change frequently. The DFD is no longer a static document but a living model that evolves with the sprint cycle. It serves as a communication tool between developers, product owners, and stakeholders during the iteration.
- Iterative Refinement: Diagrams are drawn at the start of a sprint and updated at the end.
- Focus on Value: The emphasis shifts from documenting every data point to highlighting value-generating processes.
2. Event-Driven and Asynchronous Flows
Traditional DFDs assume synchronous processing. If Process A sends data to Process B, B must receive it immediately. Modern systems often use queues, message brokers, and event streams. The data flow diagram must now represent:
- Asynchronous Messages: Data sent without an immediate response.
- Event Triggers: Processes that start based on external events rather than direct data inputs.
- Cloud Storage: Data stores are now often managed services (e.g., object storage, serverless databases) rather than local files.
3. Integration with Code
In modern development, there is a push toward “Model-Driven Development.” The DFD is sometimes generated or validated against the actual codebase. This ensures that the diagram reflects reality, not just the intended design.
📊 Comparative Analysis: Traditional vs. Modern
To clearly understand the differences, we can compare the two methodologies across several key dimensions. This table highlights how the approach changes based on the system context.
| Feature | Traditional DFD | Modern DFD |
|---|---|---|
| Primary Goal | Documentation and Specification | Communication and Iteration |
| Diagram Lifecycle | Created once, signed off early | Updated continuously with sprints |
| Data Flow Type | Synchronous, batch-oriented | Asynchronous, event-driven, real-time |
| Process Granularity | High-level business functions | Microservices or specific API endpoints |
| Data Stores | Local files or direct DB access | Managed services, caches, queues |
| Tools | Standalone diagramming software | Integrated development environments |
| Change Management | Formal change control board | Version control within the code repo |
| Validation | Manual review by stakeholders | Automated testing and code generation |
🔍 Detailed Breakdown of Symbols and Notations
While the core concepts of processes, data stores, and flows remain, the interpretation of these symbols has shifted.
1. Processes: Functions vs. Services
In a traditional model, a process might represent a large module, such as “Calculate Invoice.” In a modern model, this might be split into “Validate Invoice Data,” “Apply Discount Logic,” and “Generate PDF.” The modern approach favors smaller, reusable services that can be scaled independently.
- Traditional: Focuses on the business function.
- Modern: Focuses on the technical capability and API endpoint.
2. Data Stores: Persistence vs. State
Traditional diagrams explicitly show where data sits. Modern diagrams often treat state as ephemeral. Data might reside in memory (Redis), a message queue (Kafka), or a database (PostgreSQL). The DFD needs to specify not just the storage, but the consistency model (e.g., eventual consistency vs. strong consistency).
3. External Entities: Users vs. Systems
Traditionally, external entities were human users or other legacy systems. Modern DFDs frequently include third-party APIs, cloud providers, and IoT devices as external entities. The interaction patterns are more complex, involving OAuth, API keys, and webhooks.
⚖️ Process Decomposition Strategies
One of the most critical aspects of DFD creation is decomposition. This is the process of breaking down a high-level process into smaller, more detailed sub-processes.
Traditional Decomposition
The traditional rule is to decompose until the process can be implemented as a single program module. The goal is to reach a level of detail where the logic is simple enough to be coded directly. The decomposition is usually hierarchical and deep.
- Rule of Thumb: A process should have no more than 3 to 7 inputs and outputs.
- Leveling: The inputs and outputs of a parent process must match the inputs and outputs of its child processes exactly. This is known as “Balancing.”
Modern Decomposition
Modern decomposition often aligns with service boundaries. Instead of logical depth, we look for domain boundaries. A process might be decomposed into a set of microservices that communicate over a network.
- Rule of Thumb: A process should align with a single business domain or capability.
- Decoupling: Child processes do not need to match inputs/outputs exactly if they use an asynchronous queue as an intermediary.
When creating diagrams, ensure that the decomposition level matches the team’s operational capacity. Over-decomposing leads to spaghetti diagrams that are hard to read. Under-decomposing hides critical integration points.
🗃️ Data Dictionary and Storage Considerations
A Data Dictionary is the companion document to the DFD. It defines the structure of the data flowing through the diagram. Without it, the DFD is just a sketch.
1. Data Structure Definitions
Every data flow in the diagram should correspond to an entry in the data dictionary. This includes:
- Data Element Name: Unique identifier for the data point.
- Data Type: String, integer, date, etc.
- Constraints: Minimum/maximum length, allowed values.
- Description: Business meaning of the data.
2. Modern Storage Implications
Modern systems often hide the storage layer. A DFD might show a process writing to a “Store,” but the actual implementation might be a serverless function writing to a NoSQL table. The DFD should reflect the logical storage, not necessarily the physical implementation, unless the physical constraints (like latency) directly impact the process logic.
🛡️ Balancing and Consistency Rules
Consistency is the hallmark of a well-constructed DFD. If the diagram is inconsistent, it cannot be trusted as a design artifact.
1. The Balancing Rule
This rule states that the inputs and outputs of a parent process must be identical to the sum of the inputs and outputs of the child processes. For example, if the Level 0 diagram shows “Sales Order” entering the system, every Level 1 diagram representing the system must also show “Sales Order” entering at least one process.
- Why it matters: It ensures no data is created out of thin air or lost without explanation.
- Modern Exception: In asynchronous systems, a child process might generate a log entry that the parent does not explicitly pass. This is acceptable if the log is considered a side effect rather than a primary data flow.
2. Naming Conventions
Consistent naming prevents ambiguity. Use verbs for processes (e.g., “Validate Login”) and nouns for data flows (e.g., “Login Credentials”).
- Traditional: Strict adherence to the same name for the same data across all levels.
- Modern: Allows for normalization. Data might be “Order ID” in the UI layer but “order_uuid” in the database layer. The DFD should map these relationships clearly.
⚠️ Common Pitfalls in Both Methodologies
Even with a solid methodology, errors occur. Being aware of common mistakes helps maintain diagram quality.
1. The Control Flow Mistake
A common error is drawing control logic (if/else statements) as data flows. DFDs should not show decision points. Decision points belong in the process description or pseudocode, not on the diagram itself.
- Correction: Use a process box to represent the decision logic, but do not label the arrow with the condition (e.g., “If Valid”).
2. The Black Hole Syndrome
This occurs when a process has an input but no output. This implies data is being consumed and discarded without a result. While logging is a valid exception, it should be intentional.
3. The Miracle Syndrome
This is the opposite of a black hole. A process produces an output without an input. This implies data is being generated magically. In reality, data must come from a data store, an external entity, or a previous process.
4. Over-Complexity
Trying to fit the entire enterprise into one diagram is a mistake. Keep diagrams focused. A single diagram should cover one specific subsystem or function.
🔄 Integrating DFDs into Development Cycles
How do you use these diagrams in a real-world project?
1. The Planning Phase
Before coding begins, create a high-level Context Diagram. This aligns stakeholders on what is inside the system and what is outside. This prevents scope creep.
2. The Development Phase
For modern teams, update the Level 1 diagram as features are built. Use the diagram to identify missing integration points. If a new API endpoint is added, update the data flows immediately.
3. The Maintenance Phase
When fixing bugs, refer to the DFD to understand data lineage. If data is missing, trace the flow back to its source. This is often faster than reading through code in complex legacy systems.
🔮 Future Directions in System Modeling
As technology evolves, so will DFD methodologies. Several trends are emerging.
- AI-Assisted Diagramming: Artificial intelligence tools can now suggest process structures based on natural language requirements. This reduces the manual effort of drawing.
- Dynamic Visualization: Instead of static images, future DFDs might be interactive dashboards that show real-time data usage and bottlenecks.
- Integration with Observability: Diagrams will link directly to monitoring tools. A red dot on a process in the diagram could indicate an actual error in the production environment.
The core purpose remains the same: clarity. Whether using a pen and paper or an AI-assisted cloud tool, the goal is to make the invisible visible. By understanding the strengths and limitations of both traditional and modern approaches, system architects can choose the right tool for the job.
🛠️ Best Practices for Implementation
To ensure your DFDs remain valuable assets, follow these guidelines.
- Keep it Simple: If a diagram has more than 20 processes, split it into multiple views.
- Use Color Wisely: Use color to indicate status or ownership, not to decorate. For example, red for external entities, blue for internal processes.
- Version Control: Treat diagrams as code. Store them in a repository. Document the version and the date of the last review.
- Review Regularly: A diagram that is not reviewed is a lie waiting to happen. Schedule quarterly reviews with the development team.
- Focus on Data: Remember that DFDs are about data, not logic. Keep the control flow out of the diagram.
By adhering to these practices, you ensure that your system documentation remains a reliable source of truth throughout the lifecycle of the software.
📝 Final Thoughts
The choice between traditional and modern DFD methodologies depends on the nature of the project. Legacy systems and regulated industries often benefit from the strict documentation of traditional methods. Agile environments and cloud-native applications benefit from the flexibility of modern approaches.
Neither approach is inherently superior. They are tools designed for different contexts. The key is to understand the underlying principles of data flow and apply them with the appropriate level of rigor. Whether you are mapping a batch processing job or a real-time chat application, the Data Flow Diagram remains a vital instrument for system design.
Focus on accuracy, consistency, and clarity. These three pillars will ensure your diagrams serve their intended purpose: guiding the development of robust, efficient, and maintainable systems.