

Understanding how data moves through a system is critical for effective system analysis and design. A Data Flow Diagram (DFD) provides a visual representation of this movement without getting bogged down in technical implementation details. For busy professionals, grasping these fundamentals enables clearer communication between stakeholders, developers, and business analysts.
This guide outlines the core concepts, structural elements, and best practices for creating effective Data Flow Diagrams. It focuses on the logical flow of information rather than the physical architecture, ensuring clarity across technical and non-technical teams.
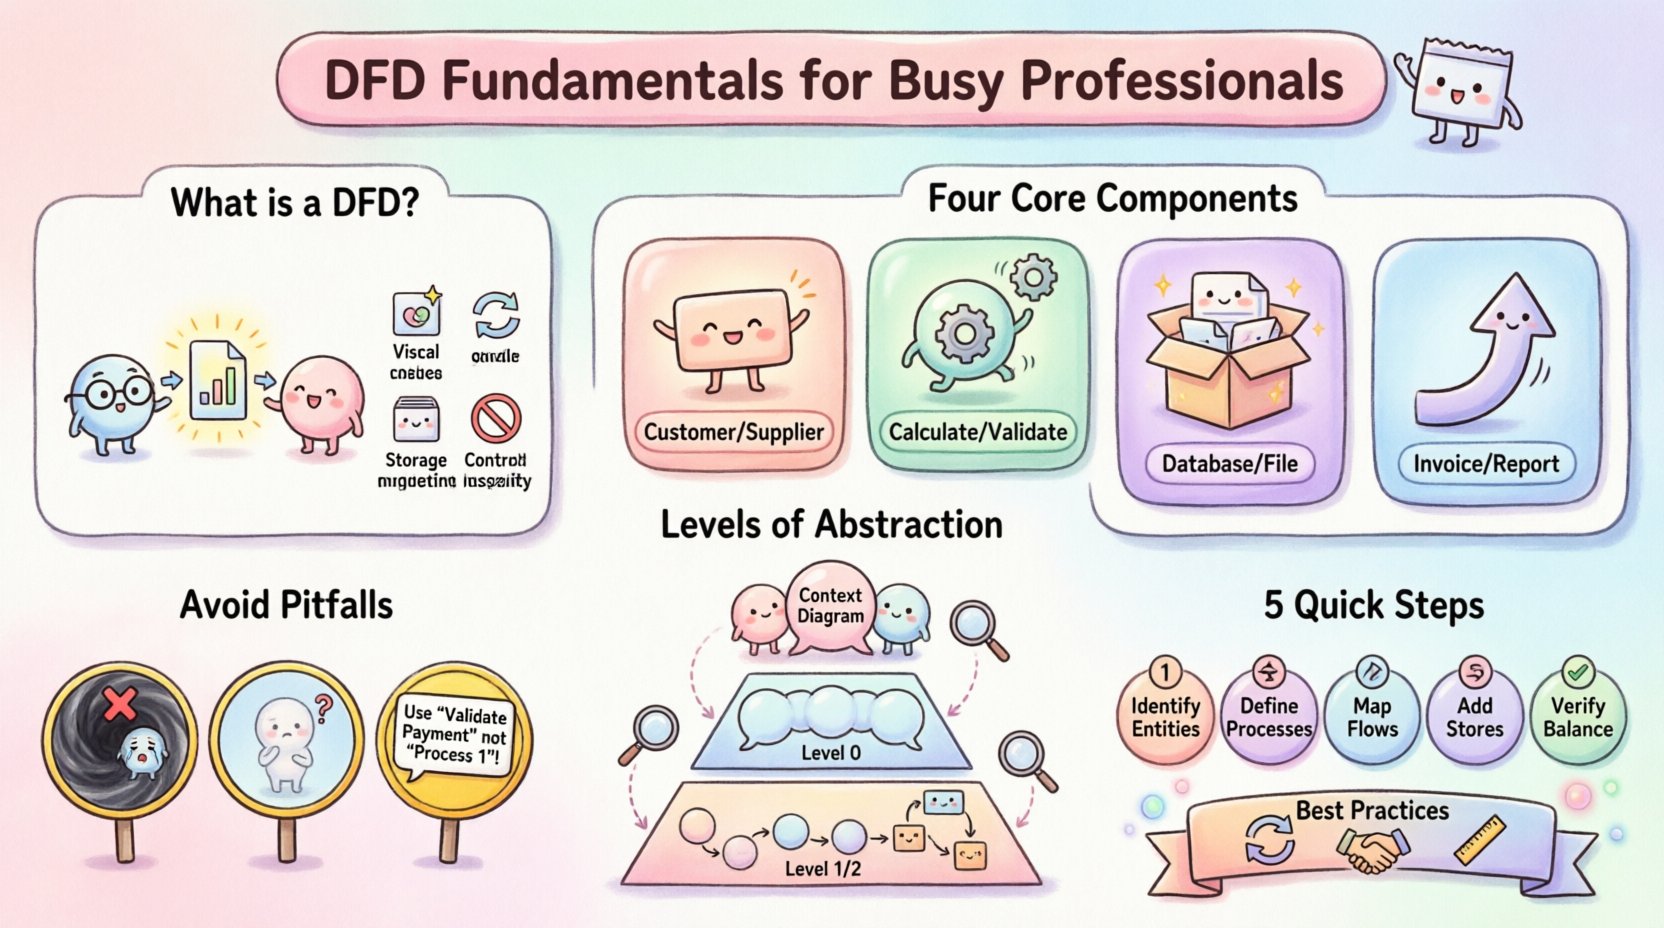
🎯 What is a Data Flow Diagram?
A Data Flow Diagram is a graphical representation used to show how data is processed by a system. Unlike a flowchart, which depicts control logic and decision-making, a DFD focuses on the movement of data between processes, external entities, and data stores.
Key Characteristics:
- 📊 Visual Focus: It maps the flow of information rather than the sequence of actions.
- 🔄 Process-Centric: It highlights transformations where data changes form or is filtered.
- 📂 Storage Aware: It identifies where data is held for future use.
- 🚫 Control Agnostic: It does not typically show loops, conditions, or timing.
For professionals managing projects or analyzing requirements, DFDs serve as a bridge between business needs and technical specifications. They help identify missing data sources, redundant processes, or unclear pathways before code is written.
🧩 The Four Core Components
To construct a valid DFD, you must understand the four standard symbols used to represent the system’s architecture. Each component plays a specific role in the data narrative.
| Component | Visual Symbol | Function | Example |
|---|---|---|---|
| External Entity | Rectangle | Source or destination of data outside the system | Customer, Supplier, Bank |
| Process | Circle or Rounded Rectangle | Transformation of data (input becomes output) | Calculate Tax, Validate Order |
| Data Store | Open Rectangle or Parallel Lines | Place where data is saved for later retrieval | Database, File, Archive |
| Data Flow | Arrow | Direction of data movement | Invoice, Payment Details, Report |
Note on Notation: While there are different styles (such as Yourdon & Coad or Gane & Sarson), the fundamental meaning of these components remains consistent. Stick to one notation style throughout a project to maintain clarity.
📉 Levels of Abstraction
A complete DFD is rarely drawn in one single view. Instead, professionals use a hierarchical approach to break down complexity. This allows stakeholders to see the big picture first, then drill down into specific details.
1. Context Diagram (Level 0)
The Context Diagram is the highest level of abstraction. It represents the entire system as a single process and shows how it interacts with external entities.
- 🔍 Scope: Defines the boundary of the system.
- 🔗 Interactions: Shows major inputs entering the system and outputs leaving it.
- 🛡️ Boundary: Clearly distinguishes what is inside the system versus what is outside.
Use this diagram when presenting the project scope to senior management or clients. It answers the question: “What does this system do for the outside world?”
2. Level 0 Diagram (Overview)
Also known as the Decomposition Diagram, this level breaks the single process of the Context Diagram into major sub-processes.
- 🏗️ Structure: Reveals the major functional areas of the system.
- 🔄 Balance: Must match the inputs and outputs of the Context Diagram.
- 🔗 Connections: Shows how high-level processes pass data between each other.
This is often the starting point for detailed design teams. It ensures that all major functions are accounted for before diving into specifics.
3. Level 1 and Level 2 Diagrams (Detail)
These diagrams break down Level 0 processes into granular steps. They are used by developers and analysts to understand specific logic requirements.
- 🧩 Granularity: Focuses on individual tasks and transformations.
- 📁 Storage: Identifies specific data stores accessed by detailed processes.
- ⚙️ Logic: Provides enough detail to write functional specifications.
Over-decomposing can lead to clutter. Stop breaking down processes when a step becomes a simple operation or a single data transformation.
🛠️ Creating a DFD: Step-by-Step
Building a robust diagram requires a methodical approach. Follow this sequence to ensure accuracy and completeness.
Step 1: Identify External Entities
Start by listing who or what interacts with the system. These are the sources and destinations of data.
- Who initiates the process? (e.g., User, Sensor)
- Who receives the result? (e.g., Manager, Regulatory Body)
- Are there external systems involved? (e.g., Payment Gateway, CRM)
Label each entity clearly. Avoid labeling them with internal roles (e.g., “Admin”) unless that role represents an external actor.
Step 2: Define Major Processes
Identify the key transformations the system performs. Each process should have a name that describes an action (verb + noun).
- ✅ Good: “Process Order”, “Verify Identity”
- ❌ Bad: “Data”, “System”, “Output”
Ensure every process has at least one input and one output. A process that takes nothing in and produces nothing is an error.
Step 3: Map Data Flows
Connect entities and processes using arrows. Label each arrow with the specific data moving across it.
- Be specific. Instead of “Information”, use “Customer Address”.
- Ensure arrows flow in the correct direction (Input → Process → Output).
- Do not cross lines unnecessarily to keep the diagram readable.
Step 4: Add Data Stores
Where is data held? Add data stores for any information that needs to persist beyond the immediate transaction.
- Distinguish between temporary storage (working memory) and permanent storage (database).
- Ensure every data store is accessed by at least one process (reading or writing).
- Avoid data stores with no connections; they are orphaned elements.
Step 5: Verify Balancing
Check that the inputs and outputs of a parent process match the inputs and outputs of its child processes.
- If the Context Diagram shows “Order Request” entering the system, the Level 0 diagram must show “Order Request” entering the main process.
- If the Level 0 shows “Report” leaving the system, the Level 1 diagram must show “Report” leaving the relevant sub-process.
🚦 Common Pitfalls to Avoid
Even experienced analysts can make mistakes when modeling data flows. Avoid these common errors to maintain diagram integrity.
❌ The Black Hole
A process that has inputs but no outputs. This implies data is disappearing into the system without being processed or stored. Every input must result in some form of output or storage.
❌ The Miracle
A process that produces outputs without receiving inputs. This suggests data is appearing from nowhere. Every output must have a source.
❌ Data Flow Confusion
Ensure arrows represent data, not control signals. A DFD is not a control flow diagram. Do not use arrows to show “if this, then that” logic.
❌ Overlapping Entities
Do not place an entity inside a process. Entities are always outside the system boundary. If an entity is inside, it is actually a process or a data store.
❌ Unclear Naming
Avoid generic names. “Process 1” tells the reader nothing. Use descriptive names like “Validate Payment” or “Update Inventory”.
📝 Best Practices for Maintenance
A DFD is a living document. As systems evolve, diagrams must be updated to reflect reality.
- 🔄 Version Control: Keep track of changes. If a process changes significantly, update the version number.
- 🤝 Stakeholder Review: Have business users validate the diagrams. They understand the data flow better than technical staff.
- 🔗 Linkage: Reference the DFD in requirements documents. This ensures traceability between business rules and system design.
- 📐 Consistency: Maintain consistent naming conventions across all levels. If “User” is an entity in Level 0, it should not be called “Client” in Level 1.
💡 Integration with System Design
While DFDs focus on logic, they inform physical design decisions. The data stores identified in a DFD often become database tables. The processes become functions or microservices.
From Logic to Database
When converting a DFD to a database schema:
- Data stores become tables.
- Data flows become foreign keys or relationships.
- Entities become users or external interfaces.
This transition requires careful attention to data types and integrity constraints, but the DFD provides the necessary roadmap.
From Logic to Interface
External entities represent users or systems that will interact with the interface. The data flows entering and leaving these entities define the API endpoints or screen inputs.
- Inputs to an entity become API requests or form submissions.
- Outputs from an entity become API responses or dashboard displays.
🧪 Testing the Diagram
Before finalizing a DFD, run it through a logical stress test.
- Trace a Path: Pick a piece of data (e.g., “Login Credentials”). Trace it from the external entity to the final data store. Does the path exist?
- Check for Loops: Ensure data is not trapped in an infinite loop within processes.
- Validate Completeness: Are all required inputs accounted for?
- Review Security: Are sensitive data flows clearly marked? Ensure unauthorized entities do not have access to sensitive data stores.
📊 Summary of Key Takeaways
Mastering the fundamentals of Data Flow Diagrams is a practical skill that enhances system analysis.
- 🎨 Visual Clarity: DFDs simplify complex systems into understandable visuals.
- 🔗 Communication: They align technical teams with business goals.
- 🏗️ Structure: They enforce a logical hierarchy from context to detail.
- ⚖️ Balance: They ensure data is neither created nor destroyed arbitrarily.
By adhering to these principles, professionals can create documentation that stands the test of time and facilitates smoother development cycles.
❓ Frequently Asked Questions
Q: Can a DFD show decision logic?
A: No. DFDs focus on data movement. Decision logic should be documented in a separate flowchart or decision table. However, you can show different data flows based on the outcome if you are mapping specific output paths.
Q: How detailed should the Level 1 diagram be?
A: It should be detailed enough that a developer could implement the process without asking further questions. If a process is ambiguous, break it down further into Level 2.
Q: Do I need to draw every single data item?
A: No. Group related data items into logical flows. For example, “Customer Data” is better than “Name, Address, Phone, Email” on a single arrow, unless the specific attributes change significantly at that point.
Q: What happens if the system changes?
A: Update the diagram. A DFD should be versioned alongside the software. If a new feature is added, add the new process and flows. If a feature is removed, delete the corresponding elements.
Q: Are DFDs still relevant in modern agile development?
A: Yes. While user stories and wireframes are common, DFDs provide a high-level view of data integrity and system boundaries that is often missing in agile artifacts. They are particularly useful for backend architecture and data migration planning.
🔚 Final Considerations
Creating a Data Flow Diagram is not merely about drawing shapes; it is about thinking through the logic of information. It requires a disciplined approach to ensure every piece of data is accounted for from origin to destination.
For busy professionals, investing time in accurate DFDs pays dividends. It reduces ambiguity, prevents scope creep, and ensures that the final system matches the intended business requirements. By following the guidelines outlined in this guide, you can produce diagrams that serve as reliable blueprints for system design.
Remember to keep the focus on the flow, not the form. The technology used to build the system is secondary to the logic of the data. Keep your diagrams clean, consistent, and aligned with the business reality.
With practice, the creation of DFDs will become a natural part of your analytical toolkit, enabling you to navigate complex system landscapes with confidence and precision.