

In the complex landscape of system analysis and software engineering, clarity is the most valuable asset. When dealing with intricate business processes or large-scale information systems, a single static map often fails to capture the necessary detail. This is where the Hierarchical Data Flow Diagram becomes indispensable. By breaking down complex systems into manageable layers, these diagrams provide a structured view of data movement without getting bogged down in implementation logic.
This guide explores the mechanics, structure, and strategic application of Hierarchical Data Flow Diagrams (HDFD). We will examine how to construct these models effectively, maintain consistency across levels, and avoid common pitfalls that compromise the integrity of the analysis. Whether you are designing a new architecture or auditing an existing one, understanding the hierarchy of data flow is essential for robust system design.
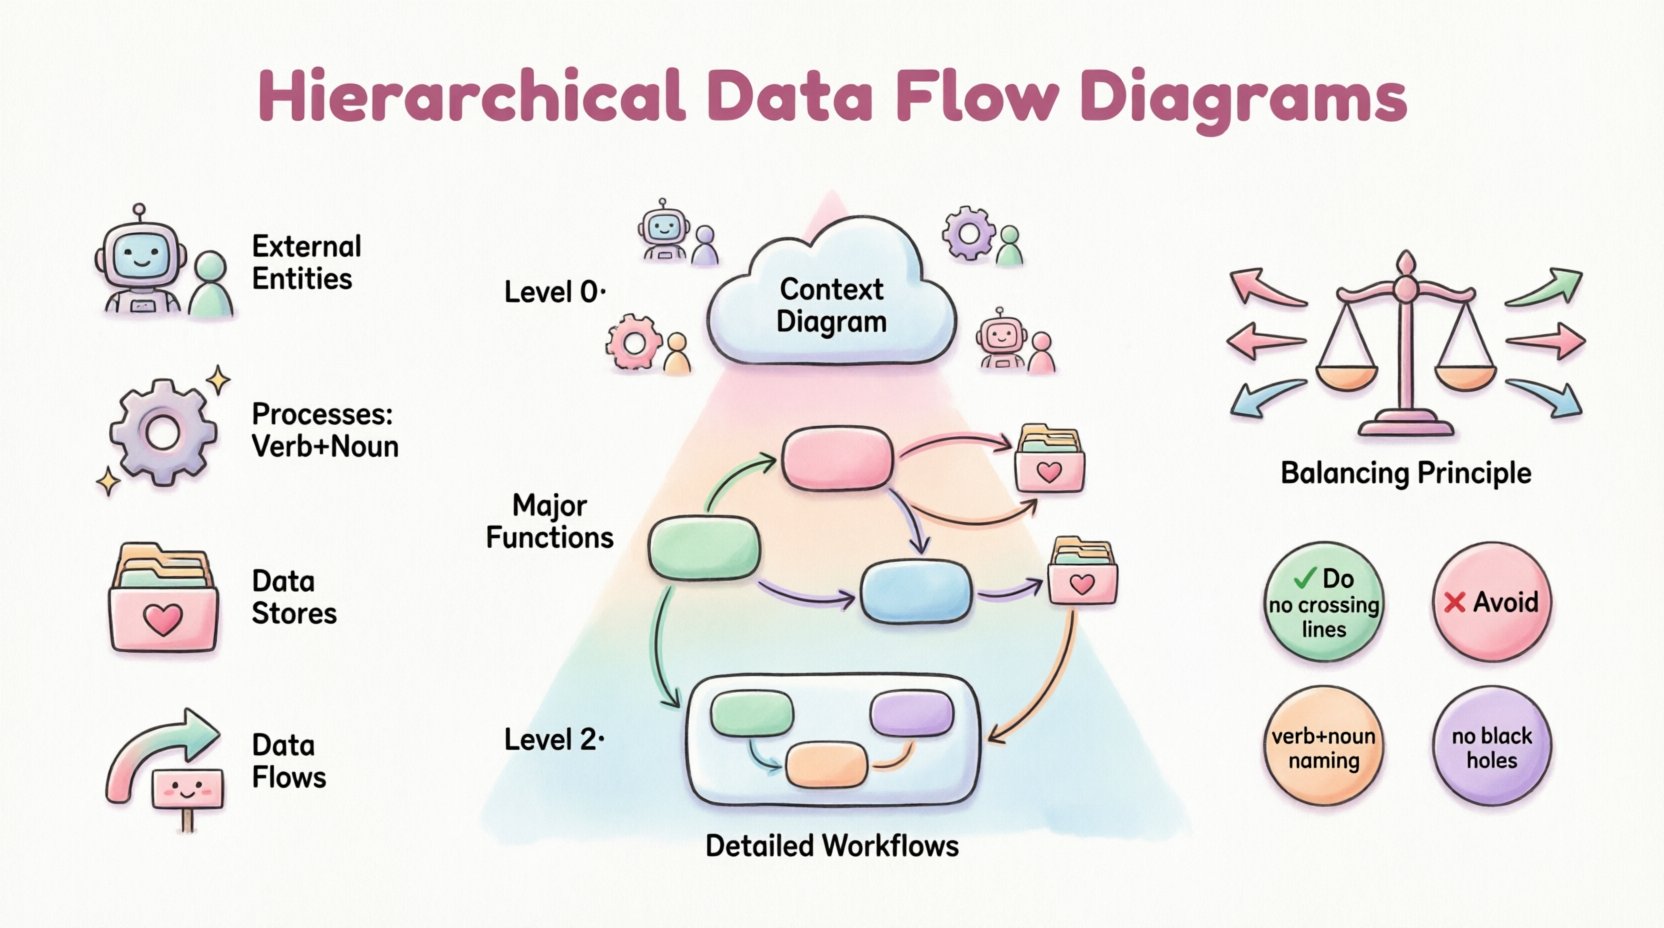
🧩 Understanding the Core Concept
A Data Flow Diagram (DFD) is a graphical representation of the flow of data through an information system. Unlike flowcharts, which focus on the logic and control flow, DFDs focus strictly on data. They answer the question: Where does the data come from, how is it transformed, and where does it end up?
When a system grows beyond a few processes, a flat diagram becomes unreadable. This necessitates the hierarchical approach. A hierarchical DFD organizes the system into a parent-child relationship of diagrams. The top-level view shows the system as a single process interacting with external entities. Lower levels expand specific processes from the level above into sub-processes, data stores, and internal flows.
Why Hierarchy Matters
- Complexity Management: Breaking a large system into smaller chunks allows analysts to focus on specific areas without losing the big picture.
- Abstraction: Stakeholders can view the system at the level of detail appropriate for their role. Executives might look at Level 0, while developers examine Level 2.
- Maintainability: Updating a specific sub-process does not require redrawing the entire system map.
🔍 The Four Fundamental Components
Before constructing a hierarchy, one must master the building blocks. Every valid Data Flow Diagram relies on four standard symbols. Deviating from these creates ambiguity.
1. External Entities 📥📤
Also known as terminators, sources, or sinks, these represent people, organizations, or external systems that interact with the system being modeled. They are the boundaries of your scope.
- Source: An entity that sends data into the system (e.g., a customer placing an order).
- Sink: An entity that receives data from the system (e.g., a government tax agency receiving reports).
- Key Rule: Entities never interact directly with other entities. All communication must pass through a process.
2. Processes ⚙️
Processes transform input data into output data. They represent work being done, decisions being made, or data being calculated. In a DFD, a process is not just a step; it is a transformation engine.
- Naming: Always use a verb-noun phrase (e.g., Calculate Tax, not Tax Calculation).
- Atomicity: A process should not be too complex. If it contains too many sub-steps, it needs to be exploded into a lower-level diagram.
3. Data Stores 🗃️
These are repositories where data is held for later use. They are passive; data does not flow out of them unless a process pulls it. Examples include database tables, file folders, or even a physical filing cabinet.
- Read vs. Write: Data can enter a store (write) or leave a store (read), but it cannot flow directly between stores without a process in between.
- Identification: Named with a noun phrase (e.g., Customer Database, Inventory List).
4. Data Flows 🔄
Data flows represent the movement of data between entities, processes, and stores. They are the arteries of the system.
- Direction: Arrows indicate the direction of data movement.
- Labeling: Every arrow must be labeled with the name of the data moving (e.g., Invoice Details, Shipping Request).
- Restrictions: Flows cannot split into nothing or merge into nothing. Data must have a purpose.
🏗️ The Levels of Hierarchy
The power of the Hierarchical DFD lies in its layered structure. Each level adds detail to the previous one. This decomposition continues until the processes are atomic enough to be implemented or understood clearly.
Level 0: The Context Diagram
This is the highest level of abstraction. It shows the entire system as a single bubble (Process 0) surrounded by external entities. It defines the boundary of the system.
- Focus: Interaction with the outside world.
- Detail: Minimal. No data stores or internal processes are visible.
- Goal: To establish the scope and identify major inputs/outputs.
Level 1: The Major Sub-Processes
Level 1 expands Process 0 from the context diagram. It breaks the single bubble into the major functional areas of the system. This is usually the first level of decomposition.
- Detail: Shows the major processes and key data stores.
- Consistency: The inputs and outputs at this level must match the context diagram exactly. This is the Principle of Balancing.
Level 2 and Beyond: Drill-Downs
Level 2 diagrams expand specific processes from Level 1. If a process in Level 1 is still too complex, it is exploded into Level 2. This can continue recursively.
- Granularity: Focuses on specific workflows within a major function.
- Usage: Often used for detailed design specifications or logic documentation.
📉 Comparison of DFD Levels
| Level | Focus | Complexity | Typical Audience |
|---|---|---|---|
| Context (Level 0) | System Boundary | Low | Stakeholders, Managers |
| Level 1 | Major Functions | Medium | Project Leads, Architects |
| Level 2 | Specific Workflows | High | Developers, Analysts |
| Level 3+ | Atomic Operations | Very High | Implementation Teams |
⚖️ The Principle of Balancing
Balancing is the most critical rule in maintaining a hierarchical DFD. It ensures that data is conserved as you move from a parent diagram to a child diagram.
If a process in the parent diagram has an input of Order Details and an output of Shipping Confirmation, the child diagram expanding that process must also have an input of Order Details and an output of Shipping Confirmation. You cannot add new data flows at the child level that did not exist at the parent level, unless they are accounted for.
- Why it matters: Without balancing, the system design becomes inconsistent. Data might appear out of nowhere or disappear into the void.
- How to enforce: Always verify inputs and outputs before finalizing a child diagram.
🛠️ Best Practices for Construction
Creating a clean, logical diagram requires discipline. Following established conventions prevents confusion and ensures the diagram remains a useful tool throughout the project lifecycle.
1. Naming Conventions
Consistency in naming is vital. Avoid generic terms like Process 1 or Data A. Use descriptive names that explain the function.
- Processes: Verb + Noun (e.g., Validate User).
- Data Stores: Noun (e.g., User Profile).
- Flows: Noun Phrase (e.g., Validation Result).
2. Avoid Control Logic
DFDs are not flowcharts. Do not include decision diamonds, loops, or if/then logic arrows. If a decision is necessary, it should be represented as a process that outputs different data flows based on the condition. For example, a Check Inventory process might output Available Stock or Out of Stock Message.
3. Limit Fan-In and Fan-Out
A process should not have an excessive number of inputs or outputs. If a process has 20 arrows pointing to it, it is likely doing too much. Decompose it further.
- High Fan-In: Suggests a bottleneck or a central hub that might need splitting.
- High Fan-Out: Suggests a process that is too broad or complex.
4. Data Store Integrity
Ensure every data store is connected to at least one process. A data store with no processes accessing it is a dead repository. Conversely, ensure data flows into a store are necessary for the system’s function.
⚠️ Common Mistakes to Avoid
Even experienced analysts can fall into traps when modeling data. Recognizing these errors early saves significant rework later.
The Black Hole
A process with only input flows and no output flows. This implies data enters the system and vanishes. Every process must produce some result, whether it is a stored record, an output message, or a change in state.
The Miracle Process
A process that has output flows but no input flows. This implies data appears out of thin air. Every piece of output must originate from somewhere, either an external entity or a data store.
The Ghost Process
A process that has the same inputs and outputs as its parent process without actually transforming the data. This is redundant and should be removed.
The Firewall
When an entity connects directly to a data store without a process in between. This violates the boundary of the system. All access to data must be mediated by a process that defines the logic of that access.
The Data Flow Crossing
Avoid crossing lines. While not a logical error, crossing lines make the diagram difficult to read. Use orthogonality (90-degree angles) and careful layout to minimize intersections. If lines must cross, use a small bridge symbol to indicate they are not connected.
🔄 Maintenance and Evolution
A DFD is not a one-time deliverable. It is a living document that evolves as the system changes. When requirements shift, the diagram must be updated to reflect the new reality. This requires a version control strategy for the diagrams themselves.
Versioning
Assign version numbers to your diagrams. When a change is made, increment the version. This allows stakeholders to track the evolution of the system logic over time.
Change Impact Analysis
When a requirement changes, trace the impact through the hierarchy. If a new input is added at Level 1, check if it affects Level 0 or Level 2. Ensure the balancing rule is maintained across all affected diagrams.
📝 Summary of Implementation Steps
To build a robust Hierarchical DFD, follow this structured approach:
- Define Scope: Identify the system boundary and external entities.
- Create Context Diagram: Draw Level 0 to establish the high-level view.
- Identify Major Processes: Decompose the system into Level 1 processes.
- Validate Balancing: Ensure inputs/outputs match between Level 0 and Level 1.
- Expand Sub-Processes: Drill down into Level 2 for complex areas.
- Review and Refine: Check for black holes, miracles, and crossing lines.
- Finalize Documentation: Annotate diagrams with rules or constraints.
🌐 The Role in System Design
Hierarchical Data Flow Diagrams serve as a bridge between business requirements and technical design. They translate abstract needs into concrete data movements. By focusing on data rather than code, they remain agnostic to the technology stack, making them useful for legacy systems, modern cloud architectures, or hybrid environments.
For teams practicing structured analysis, DFDs remain a foundational tool. They facilitate communication between business analysts, architects, and developers. When everyone agrees on the flow of data, the implementation of that flow becomes a predictable engineering task rather than a guessing game.
Whether you are analyzing a financial transaction system, a healthcare record platform, or a logistics network, the principles of hierarchy, balancing, and decomposition apply universally. Mastering these diagrams ensures that your system models are clear, consistent, and ready for the next phase of development.