

Building a robust software system requires more than just writing code. It demands a clear understanding of how information moves through the architecture. The gap between raw user requirements and technical design is often where projects fail. Data Flow Diagrams (DFDs) serve as the bridge, translating abstract needs into concrete structural models. This guide explores how to leverage DFDs as a fundamental strategy for system development, ensuring alignment between stakeholder needs and technical implementation.
Understanding the Data Flow Diagram Foundation 🧱
A Data Flow Diagram is a graphical representation of the flow of data through an information system. Unlike flowcharts, which focus on control logic, DFDs focus on data transformation and movement. They are central to structured analysis, a method that breaks down complex systems into manageable components.
When you begin the requirements phase, stakeholders describe what the system should do. They speak in terms of tasks, outcomes, and user interactions. However, developers need to know where data comes from, how it is processed, and where it ends up. DFDs answer these questions visually.
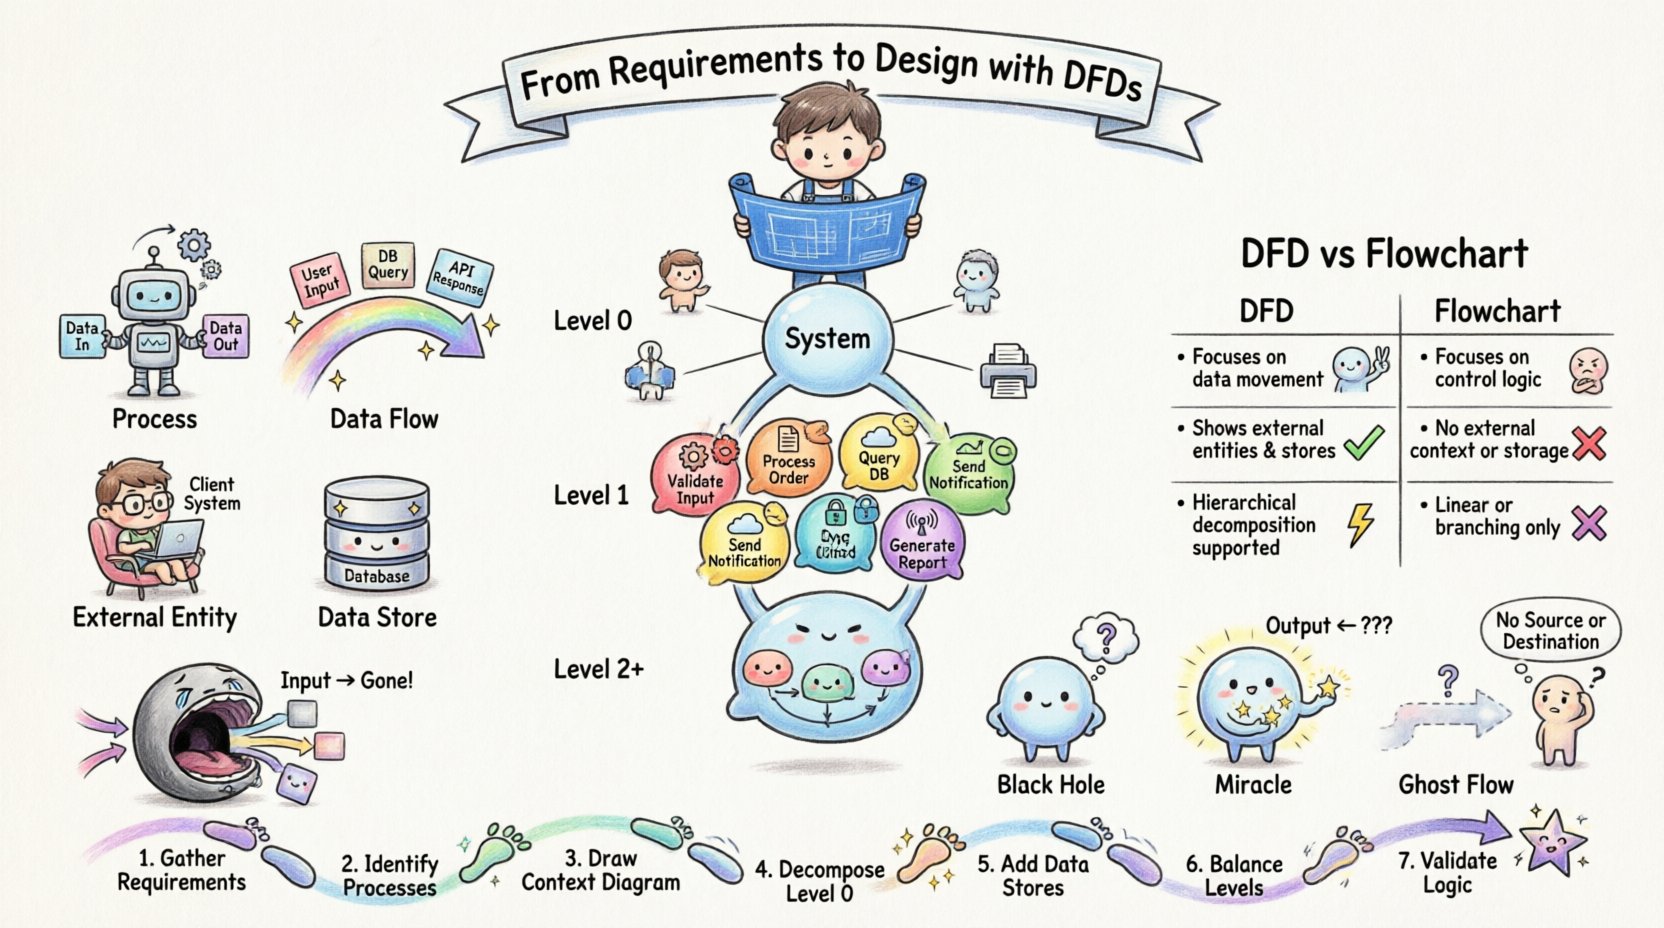
- Processes: Represent transformations of data. These are actions that change input data into output data.
- Data Flows: Represent the movement of data between processes, stores, and entities.
- External Entities: Sources or destinations of data outside the system boundary.
- Data Stores: Locations where data is held for later use.
By defining these elements clearly, teams avoid ambiguity. A requirement stating “Process the payment” becomes a specific process node with defined inputs (credit card details, order ID) and outputs (transaction record, confirmation).
The Hierarchy of Diagrams: Context to Detail 📉
DFDs are not created in a single pass. They follow a hierarchical decomposition strategy. This top-down approach ensures that the big picture is understood before diving into specifics.
1. The Context Diagram (Level 0)
The Context Diagram represents the entire system as a single process. It shows the system’s boundary and its interactions with the outside world.
- One Process: The entire system is one bubble or circle.
- External Entities: All users, systems, or organizations that interact with the system.
- Data Flows: All major data entering or leaving the system.
This diagram is crucial for validating scope. It answers the question: “What does the system exchange with the world?” If an external entity appears without a data flow, it is not interacting with the system. If a data flow exists without an entity, the data has no source.
2. The Level 1 DFD
Once the context is established, the single process is exploded into major sub-processes. This reveals the internal structure of the system.
- Decomposition: Break the main process into 5 to 9 major functions (the magic number for cognitive load).
- Data Stores: Introduce repositories where information is saved between interactions.
- Refinement: Ensure all data flows from the context diagram are accounted for at this level.
3. The Level 2 and Below
Further decomposition occurs for complex processes. Each Level 1 process can become a context diagram for its own sub-system.
- Granularity: Continue until processes are simple enough to be coded directly.
- Consistency: Every sub-process must have a clear input and output.
Mapping Requirements to Processes 📝
One of the most critical aspects of using DFDs is ensuring they reflect actual business requirements. A diagram that looks beautiful but does not match requirements is useless.
Traceability
Every process in the diagram should be traceable to a specific requirement. Conversely, every requirement should map to at least one process. This creates a bidirectional link that prevents scope creep and feature bloat.
- Requirement ID: Tag each process with the requirement number it satisfies.
- Verification: Walk through the diagram with stakeholders to confirm it matches their mental model.
Handling Business Rules
Business rules often dictate how data changes. For example, “A discount applies only if the order total is over $100.” In a DFD, this logic belongs within the process node, not as a separate flow. The process takes the order and the discount rule, and outputs the final price.
Defining Data Stores and Persistence 💾
Data stores are where the system remembers things. In a DFD, they represent databases, files, or memory buffers. Defining them correctly is vital for design.
- Read vs. Write: A data flow into a store indicates a write operation. A flow out indicates a read.
- Access Patterns: While DFDs do not show timing, they show which processes access which stores. This helps database architects understand relationships.
- State Changes: If a process reads data, modifies it, and writes it back, this should be modeled explicitly to ensure data integrity.
Common mistakes include creating data stores that no process ever reads from, or processes that have no connection to a data store when persistence is required. Every store must have at least one input and one output flow.
Balancing Inputs and Outputs ⚖️
Decomposition must be consistent. This principle is known as “balancing.” When you break a process down into sub-processes, the aggregate input and output of the sub-processes must match the parent process.
- Input Balance: If the parent process receives an order, the sub-processes must collectively receive that same order information.
- Output Balance: If the parent process sends a confirmation, the sub-processes must collectively send that confirmation.
If a flow disappears during decomposition, data is lost. If a new flow appears, it is an unexplained requirement. Balancing ensures that no information is created or destroyed within the system logic.
DFD vs. Flowchart: Know the Difference 📊
Confusion often arises between Data Flow Diagrams and traditional Flowcharts. While both depict processes, their focus is distinct.
| Feature | Data Flow Diagram (DFD) | Flowchart |
|---|---|---|
| Focus | Movement and transformation of data | Control flow and logic sequence |
| Decision Points | Not explicitly shown (logic is inside processes) | Explicit diamond shapes for branching |
| Data Stores | Explicit open-ended rectangles | Usually omitted or implied |
| Timing | Logical, not temporal | Sequential and time-based |
| Use Case | Requirements analysis and system design | Algorithm implementation and coding |
Using a flowchart to model requirements can lead to premature optimization of control logic. DFDs keep the focus on data integrity and system boundaries, which is essential during the early design phases.
Common Pitfalls and Corrections ⚠️
Even experienced analysts make mistakes when modeling. Recognizing these patterns early saves significant rework.
1. The Black Hole
A process that has inputs but no outputs is a black hole. Data enters and disappears. This indicates missing logic or a missing data flow. Every process must produce something, whether it is a record, a report, or an error message.
2. The Miracle
A process that has outputs but no inputs is a miracle. It creates data from nothing. This usually happens when a requirement is assumed rather than specified. Every output must originate from somewhere.
3. Ghost Flows
Data flows that cross the system boundary without an associated entity are ghosts. They imply data comes from or goes to nowhere. Ensure every flow connects to an entity, store, or process.
4. Over-Complication
Trying to put too much logic into one process defeats the purpose of decomposition. If a process is too large, break it down. If a diagram has too many nodes, consider splitting it into sub-system diagrams.
Integration with Documentation 📂
A DFD is not a standalone artifact. It works best when integrated with other documentation.
- Glossary: Define every data element used in the flows. “Order” might mean different things to sales and shipping.
- Data Dictionary: Detail the structure of data entering data stores.
- Process Specifications: Describe the logic inside each bubble in text or pseudocode.
This ecosystem of documents ensures that the diagram is not just a picture, but a specification. When a developer reads a process spec, they should understand exactly what the bubble represents without guessing.
Maintenance and Evolution 🛠️
Requirements change. Systems evolve. A DFD is not a static document to be filed away after the design phase. It is a living artifact that should be updated as the system changes.
- Version Control: Track changes to the diagram. Note why a process was added or removed.
- Impact Analysis: When a requirement changes, look at the DFD. Which processes are affected? Which data stores need modification?
- Communication: Use the DFD during code reviews to ensure the implementation matches the design.
Keeping the DFD current prevents technical debt. It ensures that the team maintains a shared understanding of the data architecture over time.
Practical Application Steps 🚀
Here is a streamlined approach to implementing DFDs in your next project.
- Gather Requirements: Interview stakeholders to understand what data they need and what outcomes they expect.
- Identify Entities: List all external systems and users that interact with the software.
- Create Context Diagram: Draw the system boundary and major data exchanges.
- Decompose Processes: Break the main process into sub-processes.
- Add Data Stores: Identify where information must be saved.
- Balance and Review: Check for black holes, miracles, and balancing errors.
- Validate: Walk through the diagram with the team to ensure accuracy.
Conclusion on Strategy 🎯
Data Flow Diagrams are a powerful tool for translating requirements into design. They force clarity on data movement, which is often the most misunderstood aspect of system architecture. By focusing on data rather than control, teams can build systems that are robust, maintainable, and aligned with business goals. The effort invested in creating accurate DFDs pays dividends during development and maintenance, reducing the risk of costly rework and miscommunication.
Remember, the goal is not to create art, but to create understanding. A simple diagram that accurately reflects the system is far more valuable than a complex one that confuses the team. Use DFDs to bridge the gap, ensure consistency, and guide your design from start to finish.