

In the complex landscape of software development and system analysis, time is a finite resource that often slips away unnoticed. Projects frequently face delays not because of coding inefficiencies, but due to a fundamental misunderstanding of requirements. This is where the Data Flow Diagram (DFD) becomes a critical asset. A well-structured DFD does more than map data; it clarifies the logic, exposes dependencies, and establishes a shared language between stakeholders and technical teams. This guide explores how implementing rigorous DFD practices directly influences project schedules, reduces rework, and ensures deliverables are met on time. 🛠️
🔍 Understanding Data Flow Diagrams in Project Management
A Data Flow Diagram is a graphical representation of the flow of data through an information system. Unlike flowcharts, which focus on control flow and decision logic, DFDs emphasize the movement of data between processes, data stores, and external entities. They are a cornerstone of structured analysis and design. When integrated early in the project lifecycle, they serve as a blueprint for system behavior.
Without a clear visual map, teams often proceed based on assumptions. These assumptions lead to scope creep, where features are added without understanding their impact on existing data structures. A structured DFD mitigates this by forcing a precise definition of inputs and outputs for every process.
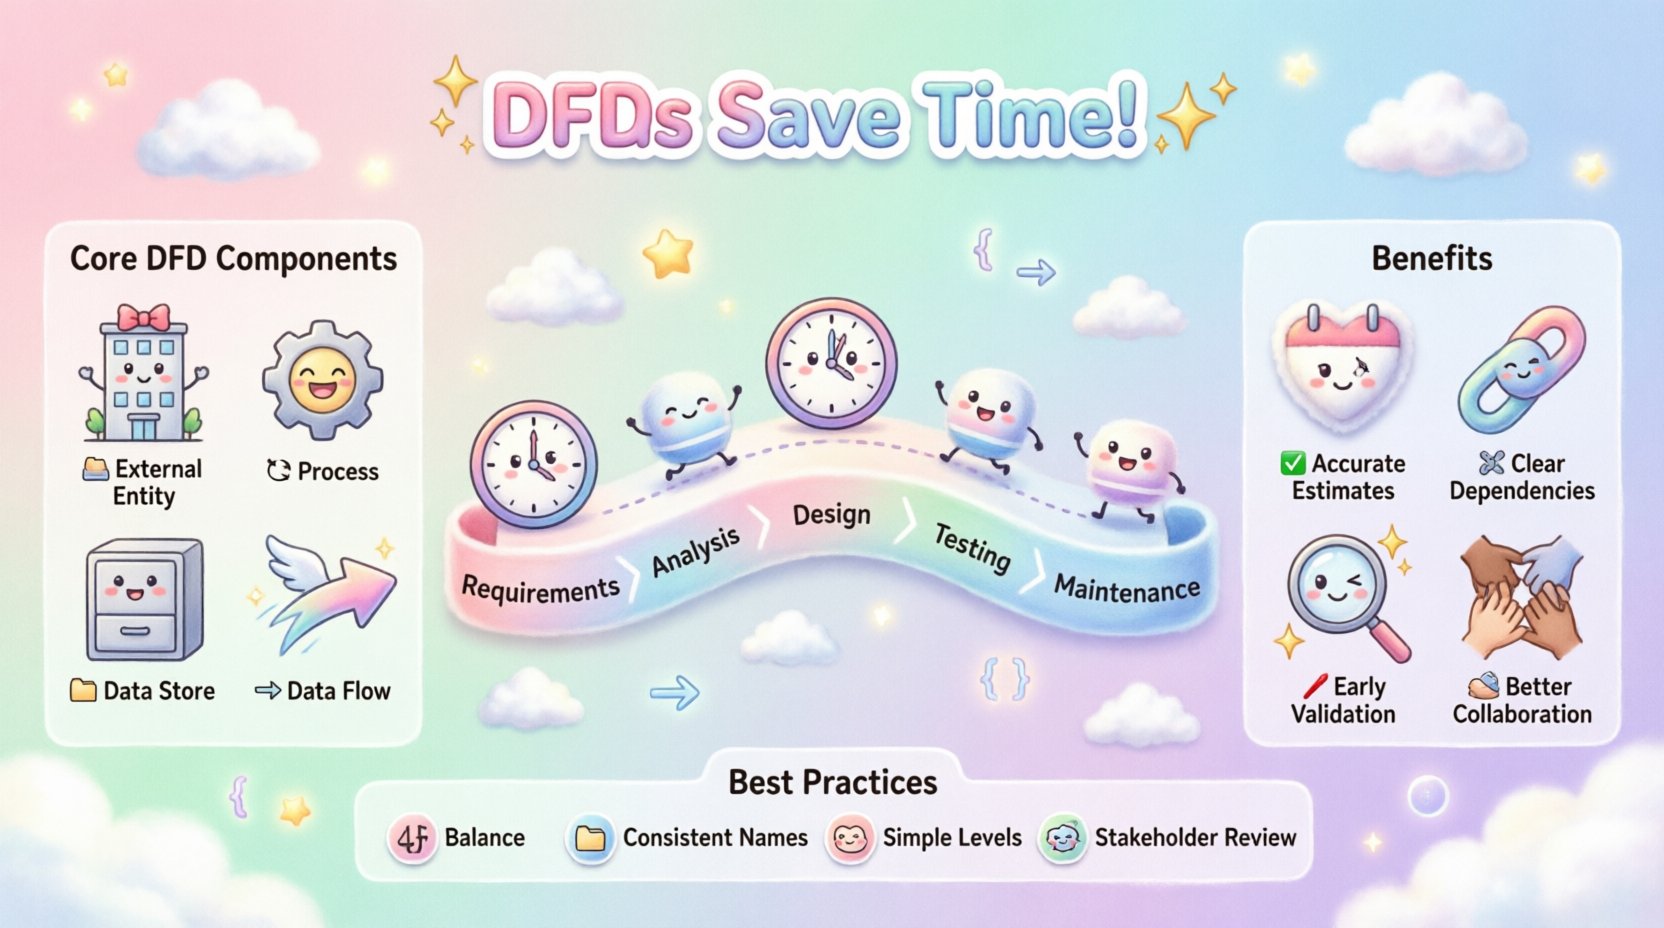
Core Components of a DFD
- External Entities: Sources or destinations of data outside the system, such as users, other systems, or departments. 🏢
- Processes: Transformations that convert input data into output data. Each process must have a verb-noun name. 🔄
- Data Stores: Where data is held for later use, such as databases or files. 📁
- Data Flows: The movement of data between entities, processes, and stores. ➡️
⚠️ The Cost of Poor Planning on Schedules
Project timelines often suffer from a phenomenon known as the “planning fallacy.” Teams underestimate the time required for tasks because they overlook hidden complexities. In system design, these complexities usually stem from ambiguous data relationships. When a DFD is skipped or done hastily, the following issues typically arise:
- Undefined Interfaces: Developers build modules without knowing exactly what data they will receive. This leads to integration failures later. 💥
- Redundant Processing: Without a clear view of data flow, different teams may create duplicate processes to handle the same data. This wastes resources and increases maintenance time. ⏳
- Testing Gaps: If the data flow is not documented, testers cannot verify that all paths are covered. Bugs found late in the cycle are expensive to fix. 🐞
- Communication Breakdowns: Stakeholders may approve a feature based on a verbal description that differs from the technical implementation. ⚖️
These issues do not just add days to a schedule; they compound. A delay in the design phase often results in a two-week delay in testing and a one-month delay in deployment due to the ripple effect of rework.
📈 How DFDs Influence Timeline Accuracy
Integrating DFDs into the project management workflow provides tangible benefits for timeline estimation. By visualizing the system, project managers can identify bottlenecks and dependencies before writing a single line of code.
1. Enhanced Estimation Precision
When processes are clearly defined, effort estimation becomes more accurate. Instead of guessing the time required for a “module,” the team estimates the time for specific processes like “Validate User Input” or “Generate Invoice.” This granularity reduces the margin of error in the schedule.
2. Dependency Identification
DFDs reveal which processes rely on the output of others. This allows for better sequencing of tasks. If Process B cannot start until Process A is complete, the schedule reflects this constraint. This prevents the common error of assigning parallel tasks that are actually sequential.
3. Early Requirement Validation
Stakeholders can review a DFD before development begins. If a data flow is missing or a process is unclear, it can be corrected in days rather than months. This front-loading of effort saves significant time during the execution phase.
📅 DFDs Across Project Phases
The impact of a Data Flow Diagram extends throughout the entire project lifecycle. Below is a breakdown of how DFDs function at each stage to protect the timeline.
| Phase | DFD Activity | Timeline Benefit |
|---|---|---|
| Requirements Gathering | Create Context Diagram to define system boundaries. | Prevents scope creep by defining what is in and out of scope. |
| Analysis | Develop Level 0 and Level 1 DFDs. | Identifies missing data stores and clarifies complex logic early. |
| Design | Refine flows for technical architecture. | Ensures database schema matches data flow needs. |
| Testing | Use DFDs to create test cases. | Ensures 100% coverage of data paths, reducing bug fixes. |
| Maintenance | Update DFDs for changes. | Reduces time spent understanding legacy code. |
This structured approach ensures that every phase builds upon a verified foundation. It minimizes the risk of having to restart a phase due to fundamental errors discovered too late.
🛠️ Best Practices for Structuring DFDs
To maximize the impact on timelines, DFDs must be constructed with discipline. A messy diagram is worse than no diagram at all, as it creates confusion rather than clarity. Follow these guidelines to ensure high-quality modeling.
- Balance the Diagram: Ensure that the number of inputs equals the number of outputs for every process. This forces a complete view of data transformation. ⚖️
- Use Consistent Naming: Data flows must have names that describe the data, not the action. Use nouns, not verbs. For example, “Customer Data” not “Send Customer Info.” 🏷️
- Limit Process Depth: Avoid putting too many processes on a single diagram. Use decomposition to break complex systems into manageable levels (Context, Level 0, Level 1). 🧩
- Avoid Control Flow: Do not include decision diamonds or loops in the diagram unless they represent data storage. Keep the focus on data movement. 🚫
- Validate with Stakeholders: Review the diagram with business users. If they do not understand the flow, the diagram has failed its purpose. 👥
🚫 Common Pitfalls That Extend Timelines
Even with the intention to use DFDs, teams often fall into traps that negate the benefits. Being aware of these pitfalls helps teams avoid unnecessary delays.
1. The “Black Box” Problem
This occurs when a process is defined without showing what happens inside. While high-level diagrams use black boxes, lower-level diagrams must show the internal logic. If a process is a black box during the design phase, developers will have to reverse-engineer the logic, which wastes time.
2. Inconsistent Decomposition
Some processes may be broken down into five sub-processes, while others remain at the top level. This inconsistency confuses the team and makes it difficult to estimate effort accurately. Consistency ensures that every part of the system is treated with the same level of detail.
3. Ignoring Data Stores
Many teams focus on processes and forget data stores. If a process writes to a database but the diagram does not show the store, the database schema may be designed incorrectly. This leads to data integrity issues and requires schema migration later, which is a major timeline risk.
4. Over-Engineering
Creating a DFD that is too detailed for the current phase can slow down progress. If a diagram requires weeks to draw, the project timeline suffers. The goal is clarity, not artistic perfection. Use standard notation to keep the creation process fast.
🤝 Improving Team Collaboration
One of the most significant hidden benefits of DFDs is improved collaboration. When developers, testers, and business analysts look at the same diagram, they share a single source of truth. This reduces the time spent in meetings clarifying misunderstandings.
- Shared Vocabulary: Everyone agrees on what “Order Processing” means. This eliminates ambiguity. 🗣️
- Visual Reference: When discussing a bug, a team member can point to a specific data flow on the diagram. This is faster than describing it in text. 🖍️
- Onboarding: New team members can study the DFD to understand the system architecture without reading thousands of lines of documentation. 📚
This collaborative efficiency translates directly into time saved. Meetings are shorter, decisions are faster, and the team moves forward with confidence.
📉 Measuring the Impact
How do you know if DFDs are helping your timeline? You can track specific metrics before and after implementing structured modeling practices.
- Rework Rate: Measure the percentage of work that must be redone. A lower rate indicates better upfront planning. 📉
- Estimation Variance: Compare estimated time versus actual time. High variance suggests poor understanding of requirements. 📊
- Defect Density: Track the number of bugs found per module. Clear data flows reduce logical errors. 🐛
- Time to Requirements Sign-off: If stakeholders approve the design faster, the project starts sooner. ⏱️
Tracking these metrics provides data-driven evidence of the value provided by system analysis. It shifts the conversation from subjective opinions to objective performance indicators.
🔄 Integration with Modern Methodologies
While DFDs originated in structured analysis, they remain relevant in agile and iterative environments. In agile projects, DFDs serve as lightweight documentation that supports sprints without the overhead of heavy waterfalls.
For example, a “User Story” in agile often describes a functional requirement. A DFD can visualize the data behind that story. This ensures that the sprint backlog includes the necessary backend work, not just the frontend interface. It prevents the common agile mistake of delivering a feature that works visually but fails logically.
Similarly, in DevOps environments, DFDs help define the deployment pipeline. Understanding where data flows helps in setting up correct database migrations and API endpoints. This reduces deployment failures, which are a major cause of timeline delays in continuous delivery.
🛡️ Risk Mitigation Strategy
Project managers should treat DFD creation as a risk mitigation strategy. Just as a financial team creates a budget to mitigate financial risk, a technical team creates a DFD to mitigate technical risk. By investing time in the diagram, you reduce the risk of catastrophic failure during integration.
Consider the DFD as a safety net. If the code fails, the diagram helps locate the source of the error. If the schedule slips, the diagram helps identify which process is the bottleneck. This diagnostic capability is invaluable when a project is already behind schedule.
💡 Final Thoughts on Discipline
The relationship between Data Flow Diagrams and project timelines is direct and significant. Projects that invest in clear, well-structured diagrams tend to finish closer to their original schedule. They experience fewer surprises and less rework. The discipline required to create a DFD pays dividends in execution.
It is not about drawing pretty pictures; it is about thinking clearly. When you map the data, you map the reality of the system. This reality becomes the foundation upon which the project is built. Without it, you are building on sand. With it, you are building on rock. 🏗️
Organizations that adopt this practice find that their teams become more productive. The time saved in meetings and debugging adds up to weeks of productive development time. For any project where complexity and accuracy matter, the effort spent on DFDs is an investment in the timeline itself. 🚀