

In the intricate world of system design, clarity is currency. When teams attempt to understand how data moves through a complex application, text alone often fails. Ambiguity creeps in, requirements get misunderstood, and the final build may diverge from the initial vision. This is where the Data Flow Diagram (DFD) becomes indispensable. It serves as a visual blueprint, mapping the journey of information from input to output without getting bogged down in the mechanics of implementation.
A DFD does not show how a system works technically; it shows what data is processed, where it comes from, and where it ends up. This guide provides a comprehensive look at the structure, purpose, and creation of Data Flow Diagrams. We will explore the core components, the hierarchy of levels, and the rigorous rules that keep these diagrams accurate. Whether you are a system analyst, a software architect, or a developer, understanding this notation is vital for building reliable systems.
🧭 What is a Data Flow Diagram?
A Data Flow Diagram is a graphical representation of the flow of data through an information system. Unlike flowcharts, which focus on control flow and decision logic, DFDs focus strictly on data movement. They highlight how data is transformed, stored, and retrieved. This distinction is critical because it separates the functionality from the control logic.
DFDs were developed by Yourdon and Constantine in the 1970s as part of structured analysis. They remain relevant today because they provide a high-level view of system requirements that is easy for stakeholders to understand. The diagram acts as a communication bridge between technical teams and business owners, ensuring everyone agrees on how data behaves before a single line of code is written.
- Focus: Data movement and transformation.
- Scope: Can cover an entire organization or a single subsystem.
- Notation: Uses standardized shapes for processes, data stores, and external entities.
- Output: A clear map of inputs, outputs, and storage points.
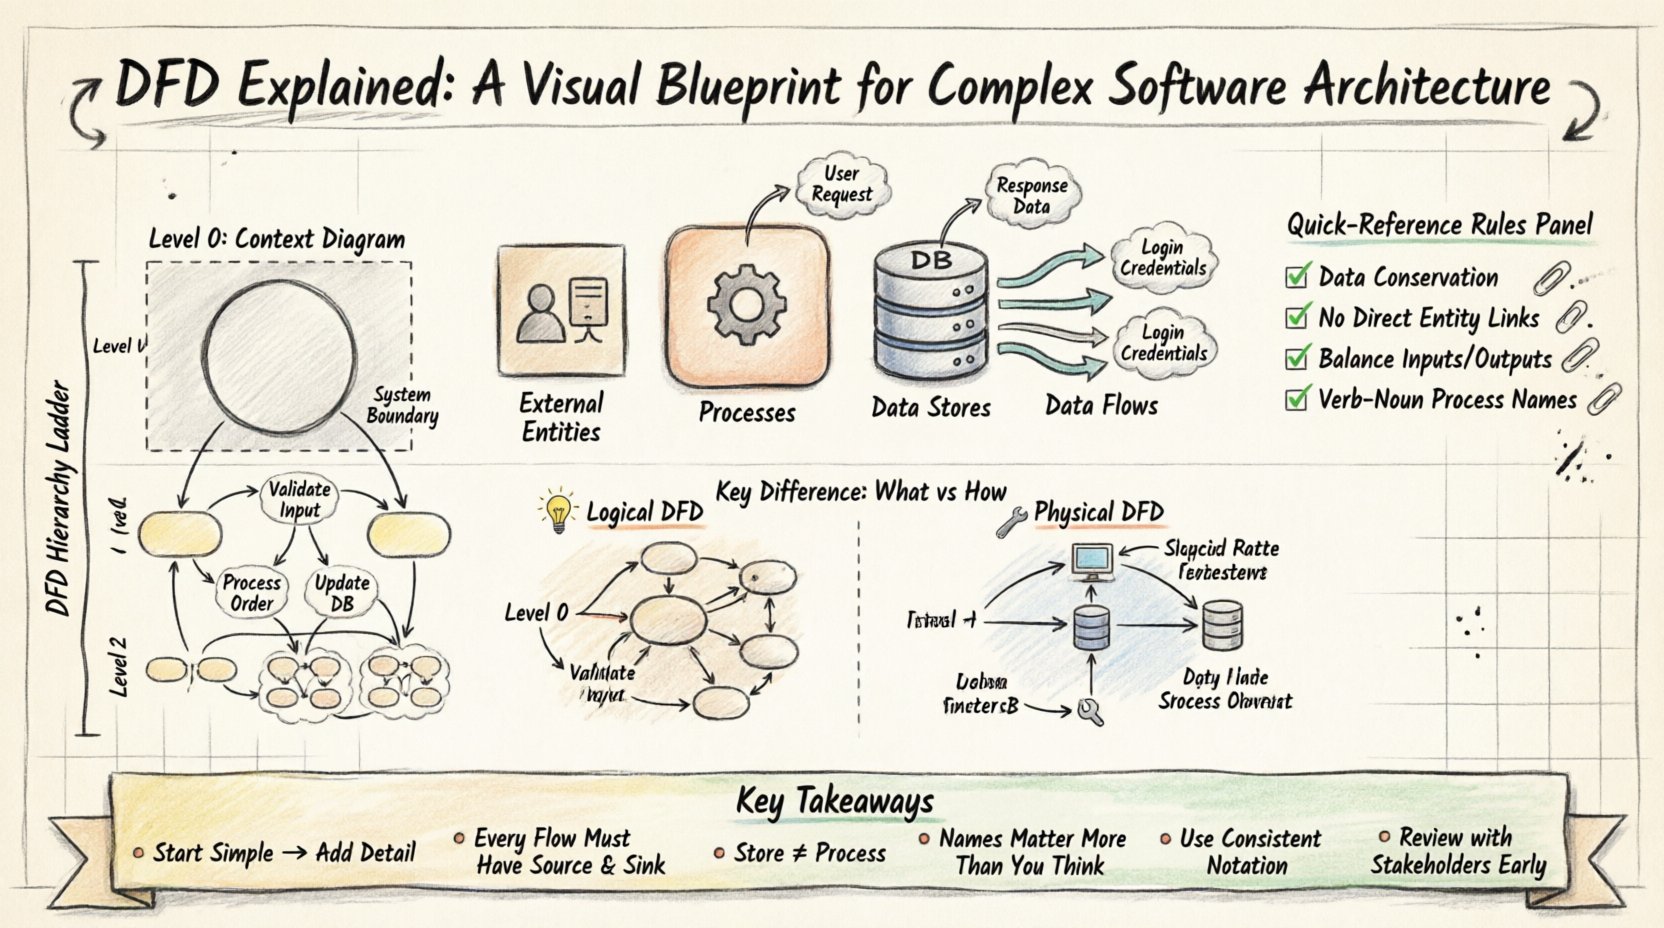
🧱 The Four Core Components of a DFD
To construct a valid DFD, you must utilize four fundamental elements. Every diagram, regardless of its complexity, is built from these building blocks. Understanding the definition and rules for each is the first step toward accurate modeling.
1. External Entities (The Actors) 🚪
External entities represent sources or destinations of data outside the system boundary. They are the users, other systems, or organizations that interact with the software but are not part of it. In a DFD, these are often depicted as squares or rectangles.
- Examples: Customers, Admins, Payment Gateways, Legacy Systems.
- Rule: Data must enter or leave the system via an entity. Nothing happens in a void.
- Placement: Usually placed at the edges of the diagram.
2. Processes (The Transformers) ⚙️
Processes represent actions that transform incoming data into outgoing data. This is the “work” being done by the system. In Gane & Sarson notation, these are rounded rectangles. In Yourdon & DeMarco notation, they are circles.
- Function: Validation, calculation, filtering, or aggregation.
- Naming: Must use a verb-noun phrase (e.g., “Validate Order” not “Order”).
- Constraint: A process cannot connect directly to another process without data flowing through it.
3. Data Stores (The Memory) 📂
Data stores represent places where information is held for later use. This includes databases, files, or even physical filing cabinets. In diagrams, they are typically open-ended rectangles or cylinders.
- Interaction: Processes read from or write to data stores.
- Labeling: Must be named with a noun (e.g., “Customer Database”).
- Permanence: Data persists beyond the immediate execution of the process.
4. Data Flows (The Arrows) 🔄
Data flows show the movement of data between entities, processes, and stores. They are represented by arrows with labels indicating the data being moved.
- Direction: Arrows must point in the direction of data movement.
- Labeling: Every arrow needs a descriptive name (e.g., “Shipping Address”).
- Prohibition: Data flows cannot connect two external entities directly without passing through a process.
📉 The Hierarchy of DFD Levels
Complex systems cannot be understood in a single view. To manage this complexity, DFDs use a technique called decomposition. This breaks a large system down into smaller, manageable sub-processes. This creates a hierarchy of diagrams known as levels.
Level 0: The Context Diagram 🌍
The Context Diagram is the highest level of abstraction. It represents the entire system as a single process. This diagram defines the system boundary and shows how it interacts with external entities.
- Single Process: The whole system is one circle or box.
- Inputs/Outputs: Shows major data inputs and outputs only.
- Purpose: Defines the scope of the project for stakeholders.
Level 1: The Major Functions 🔍
Level 1 breaks the single process from the Context Diagram into major sub-processes. This is where the internal structure of the system begins to emerge. You identify the main functional groups.
- Decomposition: The main process is exploded into 3 to 7 sub-processes.
- Consistency: All inputs and outputs from the Level 0 diagram must still exist here.
- Data Stores: This is where data stores are typically introduced.
Level 2 and Beyond: Detailed Logic 🧩
Level 2 diagrams take a specific process from Level 1 and break it down further. This continues until the processes are detailed enough to be implemented directly. This level is often where logic branches and specific validations occur.
- Granularity: Each process should be small and manageable.
- Readability: Avoid creating diagrams that are too dense to read.
- Termination: Stop decomposing when the process is simple enough for a developer to code.
⚖️ Logical vs. Physical DFDs
Understanding the distinction between logical and physical diagrams is crucial for effective documentation. Confusing the two can lead to premature technical decisions that limit future flexibility.
| Feature | Logical DFD | Physical DFD |
|---|---|---|
| Focus | Business requirements and data movement | Implementation details and hardware |
| Processes | Generic functions (e.g., “Process Payment”) | Specific actions (e.g., “Call Stripe API”) |
| Timing | When data is needed | When data is actually processed |
| People | Roles (e.g., “Manager”) | Specific individuals or departments |
| Technology | None | Specific software, files, or networks |
Logical DFDs are used early in the design phase to validate requirements with business users. They remain stable even if the technology stack changes. Physical DFDs are created later to guide developers. They specify which database tables are used, which servers handle the load, and how security is implemented.
🛑 Critical Rules for Accurate DFDs
To ensure the diagram remains a valid model of the system, specific rules must be followed. Violating these rules creates confusion and invalidates the analysis.
- Data Conservation: Data cannot be created or destroyed. Every input must have a corresponding output or storage.
- No Direct Entity Connections: Data must always flow through a process. Two external entities cannot talk directly.
- No Direct Store Connections: A data store cannot connect directly to an external entity. Data must be processed first.
- Balancing: Inputs and outputs of a parent process must match the inputs and outputs of its child processes exactly. If a Level 0 process accepts “Order Data,” a Level 1 process must also accept “Order Data”.
- Black Hole: A process cannot exist without both input and output. If data goes in but nothing comes out, it is a black hole.
- Gray Hole: A process cannot have less output than input. If you put 5 items in, you cannot get 2 out unless they are stored.
- Process Naming: Every process must have a unique name that describes what it does.
🚧 Common Pitfalls and How to Avoid Them
Even experienced architects make mistakes when modeling data flows. Recognizing these patterns early saves significant time during development.
1. Control Flow vs. Data Flow
It is tempting to draw arrows representing signals or triggers rather than actual data. A DFD tracks data, not control. If a button click triggers an action, the data representing that click (e.g., “Click Event”) flows into the process. The action itself is not a flow.
2. Excessive Detail
Trying to include every variable in a single diagram leads to clutter. If a diagram is too complex, it fails its primary purpose: communication. Use decomposition to split the diagram into manageable levels.
3. Missing Data Stores
Sometimes diagrams show data flowing directly between processes without a break. If the data needs to be saved for later, it must go to a data store. If data is just passed through, it flows directly between processes.
4. Inconsistent Naming
Using “Customer” in one place and “Client” in another confuses readers. Establish a glossary and stick to it. Every label on a data flow and every name for a data store should be consistent throughout the documentation.
5. Unbalanced Decomposition
When moving from Level 0 to Level 1, ensure all original inputs and outputs are accounted for. If a data flow disappears in the lower level, you have lost information. If a new flow appears without a source, you have introduced magic.
🛠 Creating a DFD: A Step-by-Step Approach
Building a diagram is a systematic process. Follow this sequence to ensure logical progression and accuracy.
- Identify the System Boundary: Determine what is inside the system and what is outside. Draw a box to represent the boundary.
- List External Entities: Identify all users and systems that interact with the boundary.
- Draw Level 0: Create the Context Diagram. Place the system in the center and draw arrows to external entities.
- Analyze Inputs and Outputs: Label every arrow. Ensure you know exactly what data is entering and leaving.
- Decompose Processes: Break the central process into sub-processes for Level 1. Identify where data is stored.
- Validate Balancing: Compare Level 0 and Level 1. Ensure every input and output from Level 0 is present in Level 1.
- Refine Details: Continue to Level 2 for complex sub-processes.
- Review with Stakeholders: Walk through the diagram with business users to verify accuracy.
🔄 Maintenance and Evolution
Software systems are not static. Requirements change, new features are added, and old processes are retired. A DFD that was accurate at the start of a project may be obsolete six months later. Maintaining these diagrams is an ongoing responsibility.
Whenever a change is requested, the DFD must be updated. This ensures that the documentation matches the actual system state. If a developer changes the logic but forgets to update the diagram, future maintainers will be misled. This is often referred to as documentation drift.
- Version Control: Treat diagrams like code. Use version control to track changes.
- Change Logs: Document why a specific flow was modified.
- Regular Audits: Schedule periodic reviews of the diagrams against the live system.
Using generic diagramming tools allows for easy updates. These tools often support linking diagrams together, so when a process is updated in a child diagram, the parent can be flagged for review. This connectivity helps maintain integrity across the hierarchy.
🤝 Collaboration and Communication
The true power of a DFD lies in its ability to facilitate discussion. During a review session, a stakeholder can point to an arrow and ask, “Does this data include user passwords?” This visual cue prompts a conversation that text descriptions often miss. The diagram forces the team to think about data integrity and security at the architectural level.
It also helps in onboarding new team members. A new developer can look at the Level 1 diagram to understand how the system is organized before reading the source code. This reduces the time needed to become productive. The visual nature of the DFD lowers the barrier to entry for understanding complex logic.
🔗 Integration with Other Models
DFDs do not exist in isolation. They work best when integrated with other modeling techniques.
- Entity-Relationship Diagrams (ERD): DFDs show how data moves; ERDs show how data is related. Use the DFD to identify data stores, then use the ERD to define the structure of those stores.
- Use Case Diagrams: Use Case diagrams describe interactions from a user perspective. DFDs describe the data behind those interactions.
- Sequence Diagrams: Sequence diagrams show the timing of interactions. DFDs show the structural flow. Together, they provide a complete picture of system behavior.
📝 Summary of Key Takeaways
- DFDs map data movement, not control flow.
- There are four core components: Entities, Processes, Data Stores, and Flows.
- Levels (0, 1, 2) allow for decomposition of complex systems.
- Logical DFDs focus on business rules; Physical DFDs focus on implementation.
- Strict rules like “Data Conservation” and “Balancing” must be followed.
- Regular maintenance is required to prevent documentation drift.
- DFDs are a communication tool for both technical and non-technical stakeholders.
By adhering to these principles, you create a blueprint that stands the test of time. The effort invested in creating accurate Data Flow Diagrams pays off in reduced rework, clearer requirements, and a system that is easier to maintain. As software architecture becomes more distributed and complex, the need for clear visual data mapping will only increase. This remains a foundational skill for anyone designing robust information systems.