

Data Flow Diagrams (DFDs) have long served as the backbone of system analysis and design. They provide a clear visual representation of how data moves through a system, identifying processes, data stores, and external entities. However, as software delivery accelerates and methodologies shift towards Agile and DevOps, the role of these diagrams is undergoing a significant transformation. The static diagrams of the past are evolving into dynamic, living artifacts that support continuous integration and delivery pipelines. This guide explores the trajectory of DFDs in modern development landscapes, focusing on integration, automation, and the cultural shifts required to sustain effective documentation.
Understanding the Shift from Waterfall to Continuous Flow 🔄
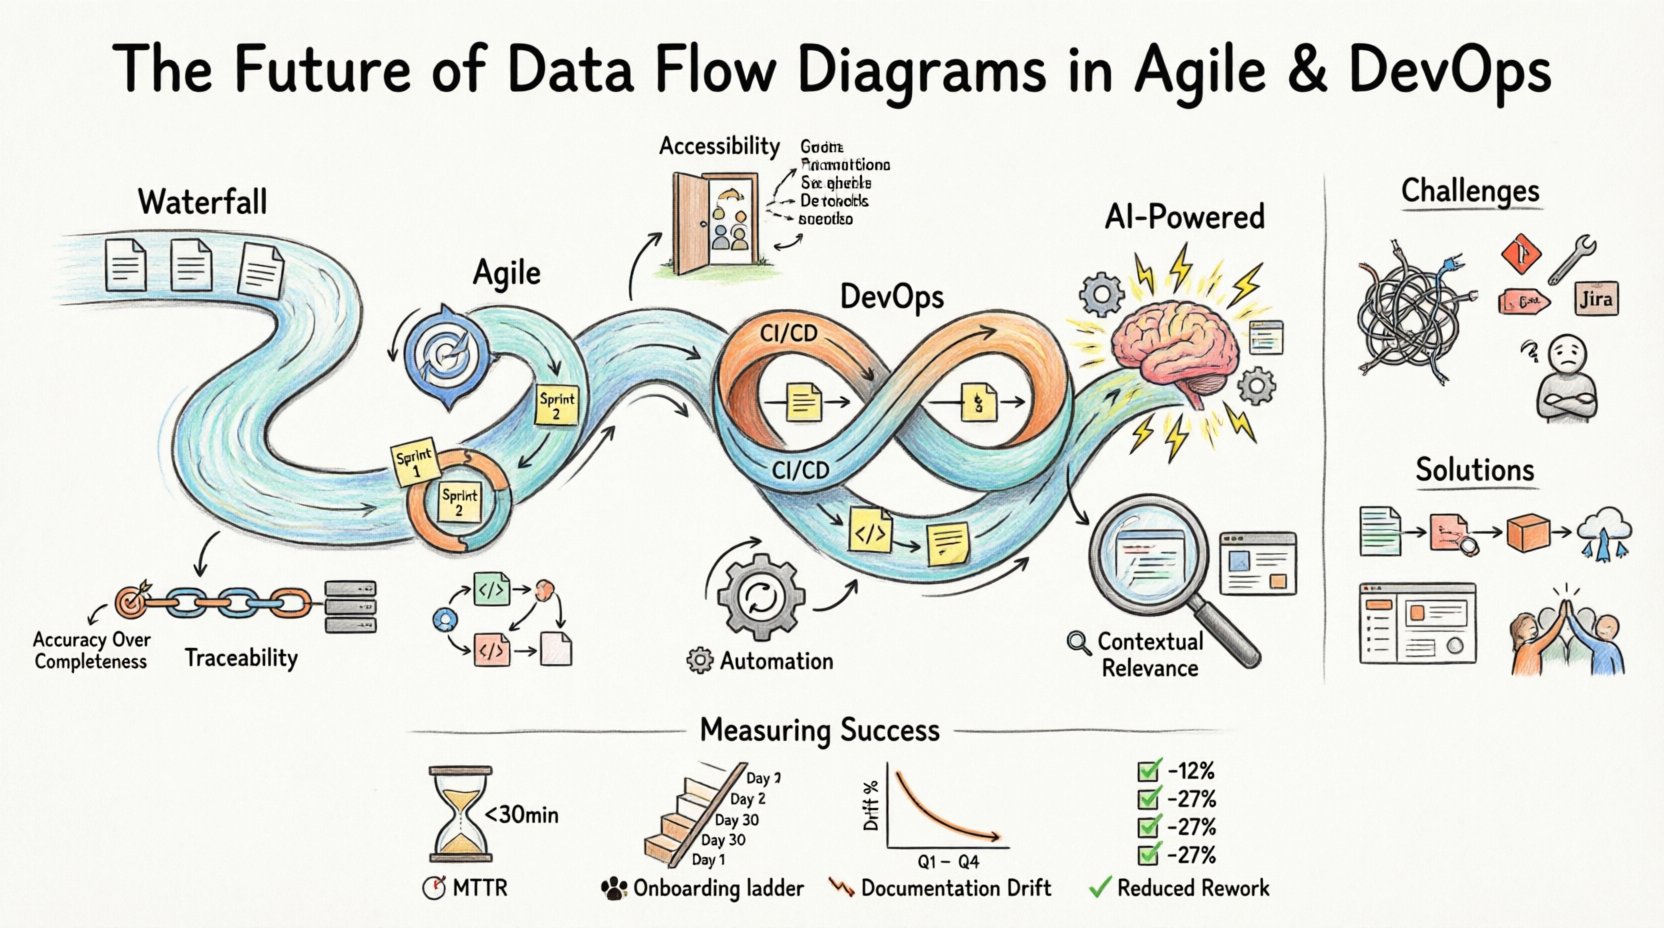
In traditional waterfall methodologies, documentation was often a gatekeeping mechanism. A Data Flow Diagram was created early in the project lifecycle and rarely changed after the design phase. This approach prioritized stability and upfront planning. Teams would spend weeks defining the architecture before writing a single line of code. While this ensured a comprehensive blueprint, it lacked the flexibility needed to respond to changing user requirements or market conditions.
Agile methodologies challenged this rigidity. The Agile Manifesto emphasizes working software over comprehensive documentation. This did not mean documentation was discarded; rather, it needed to be just enough to facilitate communication and understanding. In this context, DFDs had to become lighter, more iterative, and more accessible to the entire team, including developers, testers, and stakeholders.
DevOps further extended this evolution by bridging the gap between development and operations. The speed of deployment means that system architectures change frequently. A static diagram created at the start of a sprint may be obsolete by the end of the release cycle. Therefore, the future of DFDs lies in their ability to remain synchronized with the actual state of the system. This requires a shift from manual drawing to automated mapping and continuous synchronization.
Core Principles for Modern DFDs 📐
To survive in an Agile and DevOps environment, Data Flow Diagrams must adhere to specific principles that prioritize utility over aesthetics. These principles ensure that the diagrams add value to the development process rather than becoming a maintenance burden.
- Accuracy Over Completeness: It is better to have a diagram that accurately reflects the current state of a critical subsystem than one that maps the entire legacy system but contains outdated details. Focus on the data flows that impact the immediate release.
- Accessibility: Diagrams should be available to all team members, not just architects. They must be viewable without requiring specialized software licenses, often residing within the code repository or documentation platform.
- Traceability: Every element in the diagram should be traceable to code, tests, or operational metrics. This allows teams to understand the impact of a change in the diagram on the actual deployment.
- Automation: Wherever possible, the diagram generation process should be automated. Manual updates lead to discrepancies. Automated extraction from code or infrastructure-as-code files ensures the diagram matches reality.
- Contextual Relevance: Different stakeholders need different views. Developers need detailed process flows, while operations teams need infrastructure data flow. The system must support multiple levels of abstraction.
Integration with Agile Practices 🏃♂️
Agile development relies on short iterations and frequent feedback. Data Flow Diagrams must align with sprint cycles to remain useful. Instead of creating a massive architecture document at the project start, teams should treat DFDs as part of the definition of done for specific features.
DFDs in Sprint Planning
During sprint planning, teams often discuss user stories. A simplified DFD can help clarify the data requirements for a specific story. By visualizing where data enters and leaves a feature, the team can identify potential integration points or security considerations early. This reduces the risk of architectural debt accumulating during the sprint.
Visualizing Feedback Loops
Agile emphasizes feedback. A DFD can map not just the production data flow but also the feedback loops from monitoring systems back to the development process. For example, if an error metric triggers a deployment rollback, that path should be visible in the diagram. This helps teams understand the operational implications of their code changes.
Collaborative Design Sessions
Modern diagramming tools often support real-time collaboration. During refinement sessions, developers and business analysts can update the diagram together. This shared ownership ensures that the documentation reflects a consensus view rather than a single architect’s interpretation. It fosters a culture where documentation is a team effort.
The DevOps Connection: CI/CD and Infrastructure 🏗️
DevOps introduces the concept of Infrastructure as Code (IaC) and Continuous Integration/Continuous Deployment (CI/CD). In this environment, the infrastructure is defined by scripts and configuration files. The data flow is often dynamic, scaling up and down based on load. Static diagrams struggle to capture this fluidity.
Dynamic Mapping and Live Visualizations
The future of DFDs involves live visualization. Instead of a picture, the diagram becomes a dashboard that updates in real-time. As traffic flows through the system, the diagram highlights active paths. This is particularly useful for troubleshooting production issues. Engineers can see exactly where data is getting stuck or where latency is occurring without digging through logs.
Automated Documentation from IaC
When infrastructure is defined in code, the diagram should be generated from that code. Tools can parse Terraform, Ansible, or Kubernetes manifests to build the data flow representation. This ensures that the diagram is never out of sync with the deployed environment. If a new database is added to the IaC repository, the diagram updates automatically.
Security and Compliance Flow
DevOps teams must adhere to strict security and compliance standards. DFDs play a crucial role in identifying where sensitive data is stored and how it moves. In a CI/CD pipeline, every stage must be secure. A DFD can highlight which stages handle Personally Identifiable Information (PII) and ensure that encryption is applied at those specific points. This visual verification supports audit requirements without manual review of every configuration file.
Challenges in Maintaining Living Diagrams 🧩
While the benefits are clear, implementing dynamic DFDs presents significant challenges. Teams must navigate technical hurdles and cultural resistance to adopt these new practices effectively.
| Challenge | Impact | Mitigation Strategy |
|---|---|---|
| Technical Debt in Diagrams | Outdated diagrams mislead developers and cause production errors. | Automate diagram generation from source code and infrastructure files. |
| Tooling Fragmentation | Multiple tools create silos between design, code, and operations. | Integrate diagramming tools with the existing CI/CD pipeline and repository. |
| Cultural Resistance | Developers prefer coding over documenting; documentation is seen as overhead. | Make documentation a part of the Definition of Done and provide value to developers. |
| Complexity of Microservices | Highly distributed systems create complex, hard-to-read diagrams. | Focus on logical groupings and service boundaries rather than individual endpoints. |
| Security Concerns | Publicly accessible diagrams might expose sensitive architecture details. | Implement role-based access controls on diagram repositories and dashboards. |
Best Practices for Implementation 🛠️
To successfully integrate Data Flow Diagrams into Agile and DevOps workflows, teams should follow established best practices. These guidelines help maintain quality and relevance over time.
- Start Small: Do not attempt to diagram the entire system at once. Start with the critical path of the most recent release. Expand the diagram as the system matures.
- Version Control Diagrams: Treat diagrams as code. Store them in the same version control system as the application code. This allows for versioning, branching, and pull requests for documentation changes.
- Use Standard Notations: Avoid proprietary symbols that only one person understands. Stick to standard DFD notations or widely accepted UML conventions to ensure readability across the organization.
- Regular Reviews: Include diagram reviews in the sprint retrospective. Discuss what worked, what was confusing, and what needs to be updated for the next sprint.
- Link to Tests: Where possible, link diagram elements to the corresponding test cases. This creates a direct line of sight between the visual design and the quality assurance process.
- Keep it Simple: Avoid clutter. If a diagram becomes too complex to read at a glance, break it down into subsystem views. A clear, simple diagram is more valuable than a complex, detailed one.
The Role of Artificial Intelligence and Automation 🤖
Looking ahead, Artificial Intelligence (AI) and Machine Learning (ML) will play a pivotal role in the evolution of DFDs. These technologies offer solutions to some of the most persistent challenges in documentation maintenance.
Predictive Modeling
AI can analyze historical data flow patterns to predict bottlenecks before they occur. By understanding how data behaves under load, the system can suggest architectural improvements. The diagram can then be updated to reflect these recommended changes, serving as a proactive planning tool rather than a reactive record.
Natural Language Processing
Natural Language Processing (NLP) can convert text-based requirements into initial diagram structures. During user story definition, the system can parse the description and suggest relevant entities and processes. This reduces the initial effort required to create a diagram and helps ensure that requirements are fully captured in the design.
Self-Healing Diagrams
In a mature DevOps environment, diagrams should be self-healing. If a service is decommissioned or a new endpoint is added, the AI agent detects the change in the infrastructure state and updates the diagram automatically. This eliminates the human error of forgetting to update documentation.
Cultural Implications for Teams 👥
Technology is only half the equation. The culture of the team determines whether DFDs become a valuable asset or a forgotten artifact. Adopting these practices requires a shift in mindset.
Shared Ownership
Documentation should not be the sole responsibility of a specific role, such as a business analyst or architect. Every developer should feel responsible for the accuracy of the diagrams related to their code. This shared ownership ensures that updates happen in real-time as code changes.
Transparency
Diagrams should be visible to the entire organization, not just the engineering team. Product managers, customer support, and security teams benefit from understanding the data flow. Transparency builds trust and aligns everyone around the system’s capabilities and limitations.
Continuous Learning
The field of system architecture is constantly evolving. Teams must commit to continuous learning regarding new tools, notations, and methodologies. Regular workshops and knowledge-sharing sessions help keep the team updated on best practices for DFDs in modern environments.
Measuring Success and Value 📏
How do teams know if their investment in modern DFDs is paying off? There are several metrics and indicators to consider when evaluating the effectiveness of diagramming practices.
- Mean Time to Recovery (MTTR): Teams with accurate, up-to-date diagrams often resolve production incidents faster. The visual representation helps engineers understand the system state quickly.
- Onboarding Time: New hires can understand the system architecture more quickly if clear, current diagrams are available. This reduces the ramp-up time for new team members.
- Documentation Drift: Measure the time between a code change and the diagram update. Lower drift indicates better integration between development and documentation processes.
- Stakeholder Satisfaction: Regular feedback from non-technical stakeholders regarding their understanding of the system can indicate the clarity and usefulness of the diagrams.
- Reduced Rework: Accurate diagrams help prevent architectural mistakes in early development stages. Tracking the reduction in rework due to design errors is a strong indicator of value.
Conclusion on the Path Forward 🛤️
The future of Data Flow Diagrams in Agile and DevOps environments is one of integration, automation, and collaboration. They are moving away from static documents to dynamic, living representations of system architecture. This shift requires teams to adopt new tools and workflows but offers significant benefits in terms of system understanding, maintenance, and reliability.
By focusing on accuracy, traceability, and automation, organizations can ensure that their diagrams remain valuable assets throughout the lifecycle of their software. The goal is not to create perfect documentation but to create documentation that supports the continuous delivery of value. As technology continues to evolve, so too will the methods we use to visualize and understand the complex flows of data that power our digital world.
Teams that embrace this evolution will find themselves better equipped to handle the complexity of modern software systems. They will build more resilient architectures, deploy with greater confidence, and maintain systems that are easier to understand and modify. The journey from static diagrams to dynamic intelligence is ongoing, but the path is clear.