

In the modern digital landscape, data is the lifeblood of organizations. However, with increased connectivity and cloud adoption comes a heightened risk profile. Protecting this sensitive information requires more than just firewalls and encryption; it demands a deep understanding of how information moves through a system. This is where the Data Flow Diagram, commonly referred to as DFD, becomes an essential tool for architects and security professionals. 📊
A Data Flow Diagram provides a visual representation of the flow of data within a system. It maps out where data originates, how it is processed, where it is stored, and where it exits. By visualizing these pathways, security teams can identify potential weak points before they are exploited. This guide explores the critical role of DFDs in maintaining robust data security and privacy compliance without relying on specific commercial tools.
Understanding the Core Components of a DFD 🧩
To leverage a DFD for security purposes, one must first understand its fundamental building blocks. These elements represent the logical movement of information and are the focus of any security audit.
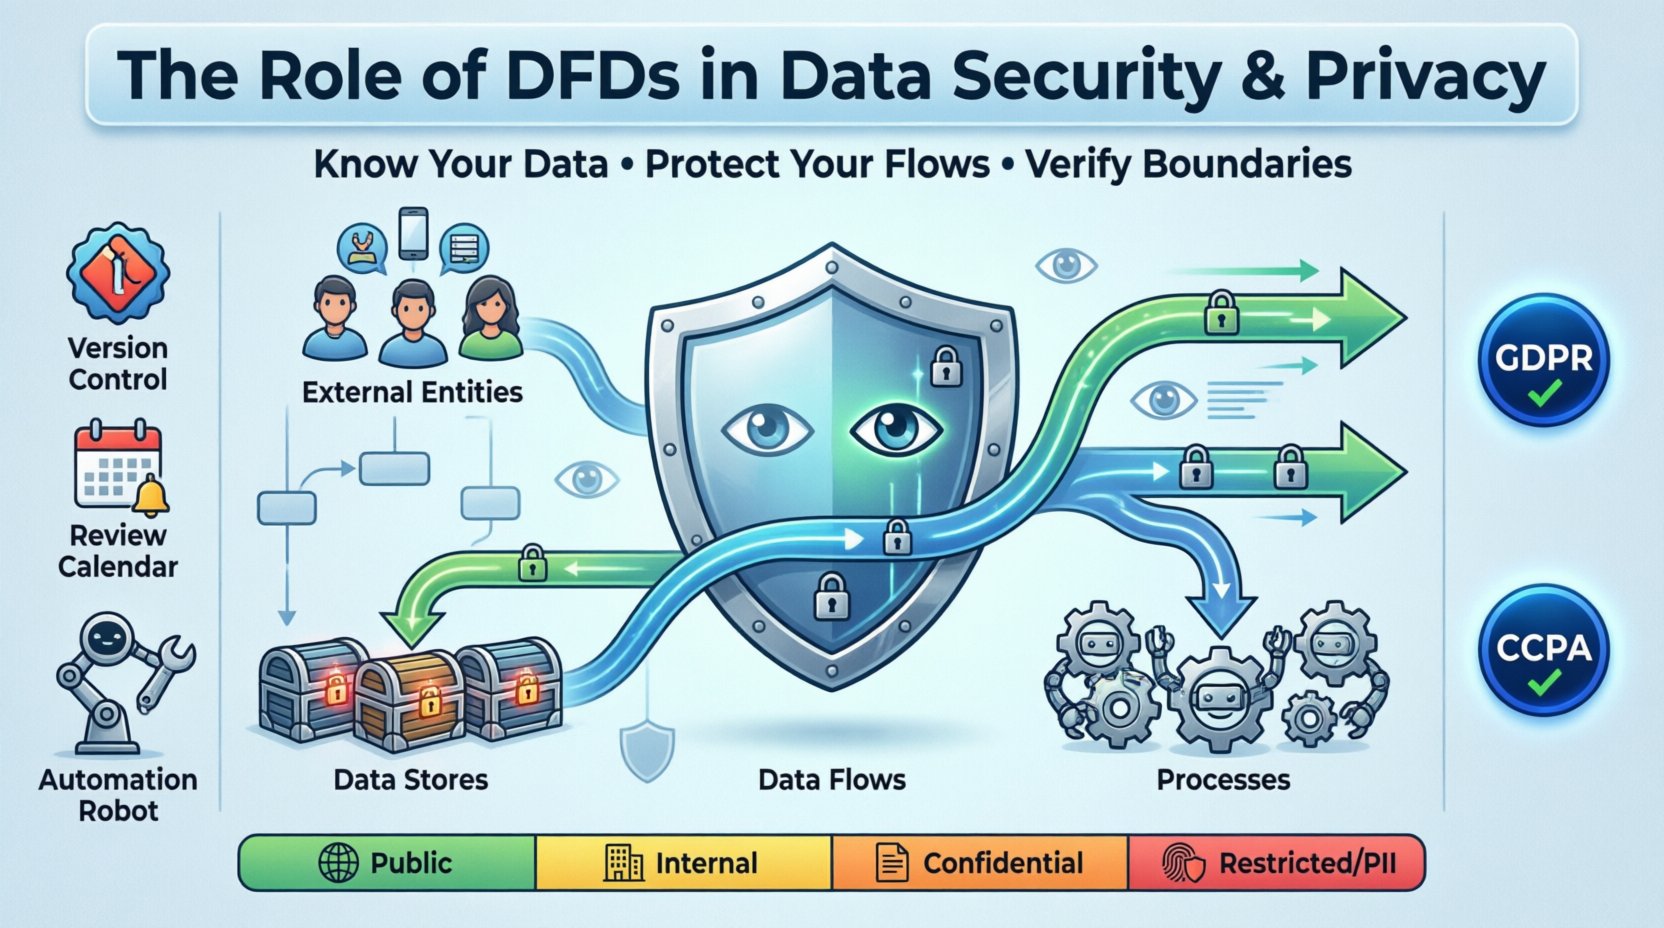
- External Entities: These represent users, systems, or organizations outside the immediate boundary of the system being analyzed. They are the source or destination of data. In a security context, external entities are often the first point of contact for potential threats.
- Processes: These are actions that transform data. A process takes input, performs an operation (calculation, validation, encryption), and produces output. Each process represents a potential point where data could be mishandled or exposed.
- Data Stores: These are repositories where information is saved for later use. They can be databases, file systems, or even physical paper records. The security posture of a data store is paramount, as it holds the accumulated value of the system.
- Data Flows: These are the arrows connecting the elements. They indicate the direction of data movement. A flow might carry login credentials, financial records, or customer preferences. Every arrow represents a transmission channel that must be secured.
When constructing these diagrams, the level of detail matters. A high-level overview might miss specific encryption points, while an overly detailed diagram can become unmanageable. The goal is to strike a balance that reveals security risks without obscuring the broader architecture.
The Intersection of Privacy and Data Flow 🕵️♀️
Privacy regulations such as the GDPR in Europe and the CCPA in California mandate that organizations know exactly where personal data resides. A Data Flow Diagram is the practical implementation of this requirement. It transforms abstract legal requirements into concrete technical maps.
Why DFDs Are Vital for Compliance
- Accountability: Regulators require proof that you know where PII (Personally Identifiable Information) goes. A DFD serves as evidence of due diligence.
- Consent Management: By mapping flows, you can ensure that data collected for one purpose is not inadvertently flowing to another system used for a different purpose without proper consent.
- Data Minimization: The diagram highlights unnecessary data transfers. If a flow exists but no process utilizes the data, it may be a candidate for removal to reduce the attack surface.
- Right to Erasure: When a user requests deletion, the DFD shows every data store and process that must be contacted to ensure the data is fully removed.
Mapping PII Through the System
Security professionals must annotate their diagrams to distinguish between general data and sensitive information. This distinction guides the application of controls. For example, a flow carrying hashed passwords requires different protection than a flow carrying non-sensitive log timestamps.
| Data Sensitivity Level | Examples | Required Security Controls |
|---|---|---|
| Public | Marketing materials, public APIs | Integrity checks, uptime monitoring |
| Internal | Employee directories, internal memos | Access controls, network segmentation |
| Confidential | Financial reports, HR records | Encryption at rest and in transit, auditing |
| Restricted (PII/PHI) | Credit card numbers, medical history | Tokenization, strict access logs, encryption keys rotation |
Identifying Security Vulnerabilities via DFD Analysis 🔍
A static diagram is useful, but an active analysis of the flows reveals where the system is weakest. Security teams use the diagram to perform threat modeling, asking specific questions about every connection.
Key Questions for Security Audits
- Authentication: Is the data flowing between processes authenticated? Does the receiving process verify the identity of the sender?
- Authorization: Just because data can move, should it? Does the receiving process have the right permissions to access this specific data type?
- Encryption: Is the data encrypted during transit? Are there any flows marked as “unsecured” or “plain text”?
- Data Validation: Are inputs validated at the process boundary? Can an external entity inject malicious data through a data flow?
- Storage Security: Are data stores isolated? Is there a risk of lateral movement if one store is compromised?
Common Flaws Revealed by Diagrams
Often, diagrams expose architectural debts that were never documented. You might find:
- Shadow Flows: Data moving through systems that were not officially approved or documented. These are often created by developers bypassing standard procedures.
- Unnecessary Retention: Data flowing into a store that is never read. This increases the liability of breach without adding business value.
- Backdoor Connections: Direct connections between external entities and data stores that bypass processing logic, often used for reporting but lacking security checks.
- Third-Party Leaks: Flows extending to external vendors that do not meet the organization’s security standards.
Integrating DFDs with Zero Trust Architecture 🏰
Zero Trust is a security model based on the principle of “never trust, always verify.” It requires a granular understanding of network and data flows. A DFD is the blueprint for implementing Zero Trust policies.
Micro-Segmentation Planning
In a traditional network, once an attacker breaches the perimeter, they move freely. Zero Trust breaks the network into small segments. A DFD helps define these segments based on data sensitivity.
- Zone Definition: Each process or group of processes can be assigned to a security zone.
- Flow Control: Policies are written to allow only specific flows between zones. If the DFD shows a flow that shouldn’t exist, it is blocked.
- Identity Verification: Every flow request is authenticated, regardless of whether it originates from inside or outside the network.
Dynamic Access Control
By continuously updating the DFD to reflect real-time changes, access control policies can be dynamic. If a new process is added, the diagram updates, and new firewall rules or API gateways are provisioned automatically based on the flow definition.
Best Practices for Maintaining Secure Data Flows 🛠️
A DFD is not a one-time document. Systems evolve, and if the diagram does not, the security posture becomes a lie. Maintenance is a continuous process.
Documentation Standards
- Version Control: Treat diagrams like code. Every change to the architecture should result in a version update of the DFD.
- Review Cycles: Schedule quarterly reviews of the DFD to ensure it matches the deployed environment.
- Change Management: Link DFD updates to the formal change management process. No deployment should happen without verifying the impact on data flows.
- Stakeholder Sign-off: Security, compliance, and engineering teams must all sign off on the diagram changes.
Automation and Monitoring
While manual diagrams are foundational, automation helps keep them accurate.
- Network Traffic Analysis: Use monitoring tools to detect traffic patterns that deviate from the DFD. Unexpected flows indicate potential compromise or misconfiguration.
- Log Correlation: Cross-reference audit logs with the data stores in the DFD. If a log shows access to a store not listed, investigate immediately.
- Automated Alerts: Set up alerts for any process attempting to write to a data store not defined in the current diagram.
Challenges in DFD Implementation 🚧
Despite their benefits, creating and maintaining accurate DFDs presents challenges. Acknowledging these helps teams navigate the process more effectively.
- Complexity: Large enterprise systems have thousands of flows. Creating a single diagram is impossible. Hierarchical modeling is required, breaking the system into subsystems.
- Obsolescence: Technology changes rapidly. A diagram created during a cloud migration might be outdated within months if not maintained.
- Human Error: Diagrams are often created by people who do not fully understand the underlying security implications. Security specialists must review them.
- Legacy Systems: Older systems may not have clear documentation. Reverse engineering the data flows requires significant effort and access to source code or database schemas.
The Role of DFDs in Incident Response 🚨
When a security incident occurs, time is critical. A well-maintained DFD becomes a vital reference guide for the incident response team.
Containment Strategy
- Identify Scope: The diagram shows which systems are connected to the compromised component. This helps determine how far the breach might have spread.
- Isolate Flows: Teams can quickly identify which data flows to sever to stop the exfiltration of data.
Forensic Analysis
- Trace Path: Investigators can trace the path of the attack through the logical flows defined in the diagram.
- Data Impact: The diagram clarifies exactly what data was accessible during the breach, which is crucial for legal notifications.
Future Trends in Data Flow Visualization 📈
As systems become more complex with microservices and serverless architectures, the role of DFDs will evolve. Static diagrams are being supplemented by dynamic, real-time mapping.
- Service Mesh Integration: Modern architectures use service meshes to manage traffic. These tools can generate flow maps automatically.
- AI-Driven Analysis: Artificial intelligence can analyze traffic patterns and suggest updates to the DFD, highlighting anomalies that humans might miss.
- Cloud-Native Visibility: Cloud providers offer tools to visualize data movement across regions and accounts, integrating these views into the overall DFD strategy.
Conclusion on Security Architecture 🎯
Data security is not a product you buy; it is a practice you maintain. The Data Flow Diagram is a foundational tool in this practice. It provides the clarity needed to understand where data lives and how it moves. Without this visibility, security measures are applied blindly.
By rigorously defining, analyzing, and maintaining data flows, organizations can reduce risk, ensure compliance, and build trust with their users. The effort required to create accurate diagrams pays dividends in the form of a resilient, secure architecture. As technology advances, the principles remain the same: know your data, protect your flows, and verify your boundaries.
Start by mapping your current systems. Identify the sensitive data points. Secure the paths between them. This systematic approach forms the bedrock of modern data privacy and security. 🛡️🔒