

Data Flow Diagrams (DFDs) serve as the foundational blueprints for system analysis and design. They visualize how information moves through a system, highlighting processes, data stores, and external entities. However, a single diagram often cannot capture the complexity of modern software or business processes. This is where the hierarchy of DFD levels becomes essential. By breaking down a system into Level 0, Level 1, and Level 2 diagrams, analysts create a structured narrative that is both manageable and precise.
This guide explores the technical nuances of DFD hierarchies. We will examine the specific purpose of each level, the rules governing their creation, and the critical practice of balancing. Whether you are designing a database schema or mapping a business workflow, understanding these layers ensures clarity and reduces ambiguity.
Why Hierarchy Matters in System Design 🧩
Complexity is the enemy of understanding. When a system involves multiple departments, external vendors, and intricate data transformations, a single overview diagram becomes cluttered. It obscures details and confuses stakeholders.
Hierarchy solves this by applying the principle of decomposition. Decomposition means taking a complex whole and breaking it into smaller, logical parts. In the context of DFDs, this allows us to zoom in on specific areas without losing the context of the larger system.
- Clarity: Each level focuses on a specific scope of the system.
- Manageability: Smaller diagrams are easier to review and validate.
- Collaboration: Different teams can work on different levels without conflict.
- Traceability: You can trace a data element from the high-level context down to the specific process logic.
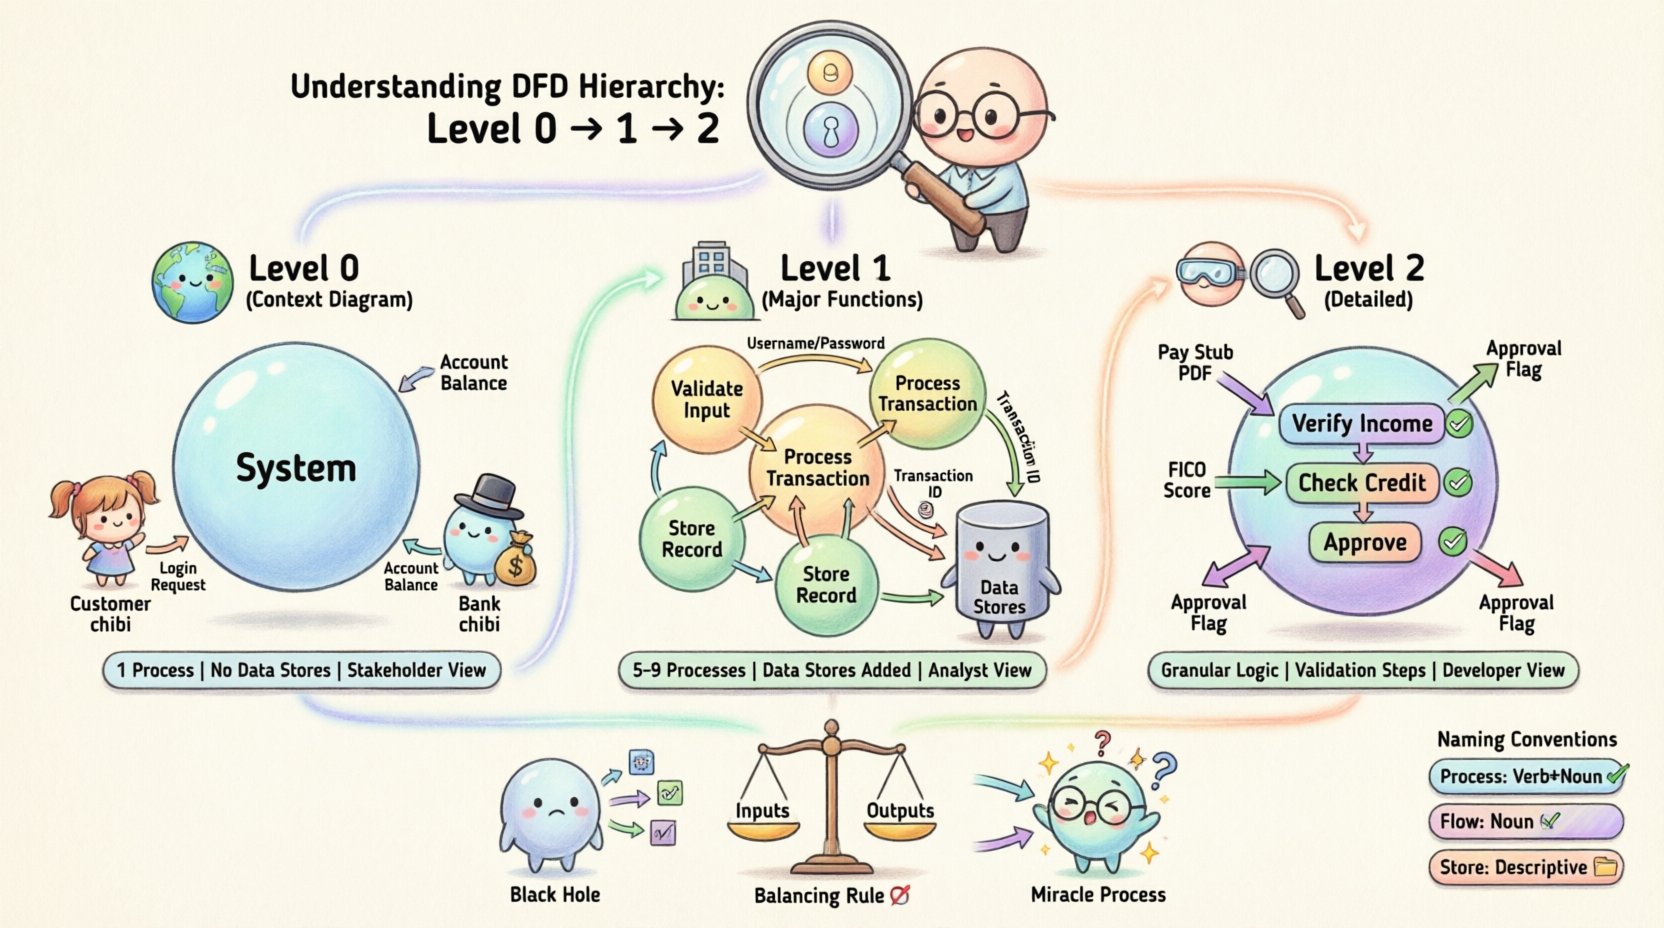
Level 0: The Context Diagram 🌍
The Level 0 DFD, often called the Context Diagram, provides the high-level view of the system. It represents the system as a single process and defines the boundaries of that system.
Key Characteristics of Level 0
- Single Process: The entire system is represented by one bubble or circle. This process usually bears the name of the system itself.
- External Entities: These are the sources and destinations of data. They exist outside the system boundary. Examples include Users, Suppliers, Regulatory Bodies, or other Systems.
- Data Flows: Arrows connect entities to the central process. They represent the input and output of the entire system.
- No Data Stores: Typically, Level 0 diagrams do not include internal data stores. The focus is strictly on the interaction between the system and the outside world.
The goal of the Level 0 diagram is to answer the question: “What does this system do, and who interacts with it?” It sets the stage for the detailed breakdown that follows.
Example Scenario
Imagine an Online Banking System.
- Central Process: Online Banking System
- External Entity 1: Customer
- External Entity 2: Banking Network
- Data Flow 1: Login Request (Customer to System)
- Data Flow 2: Account Balance (System to Customer)
- Data Flow 3: Transaction Confirmation (System to Banking Network)
This single diagram defines the perimeter. It tells us that the system talks to customers and the banking network, but it does not show how the login is verified or how transactions are recorded internally.
Level 1: The Major Functions 🏗️
Level 1 DFDs take the single process from the Level 0 diagram and decompose it into major sub-processes. This level reveals the internal structure of the system without getting bogged down in minute details.
Characteristics of Level 1
- Multiple Processes: The central bubble from Level 0 is replaced by several smaller bubbles (usually 5 to 9). These represent major functional areas.
- Data Stores: This is the first level where internal data stores are introduced. These are repositories where information is kept for later use.
- Refined Flows: Data flows are more specific. Instead of “Login Request,” it might be “Username and Password”.
- Continuity: All input and output data flows from Level 0 must still exist in Level 1. This is the first step of the balancing rule.
Structuring the Decomposition
When creating a Level 1 diagram, you must group processes logically. Common groupings include:
- Authentication: Verifying user identity.
- Transaction Processing: Handling the core business logic.
- Reporting: Generating summaries or logs.
- Administration: Managing user accounts or system settings.
Data stores are connected to these processes. For instance, the Authentication process might read from a “User Credentials” data store, while the Transaction Processing process writes to a “Transaction Log”.
Level 2: Detailed Processes 🔍
Level 2 DFDs zoom in further. They focus on specific sub-processes from the Level 1 diagram. This level is often used when a specific function is complex enough to require detailed logic documentation.
When to Use Level 2
You do not need a Level 2 diagram for every process in Level 1. Only decompose processes that are complex. If a Level 1 process is simple (e.g., “Display Message”), it does not need further breakdown. However, if a process is “Calculate Interest,” it likely requires Level 2 detail.
Characteristics of Level 2
- Granularity: Shows the specific steps taken to complete a task.
- Validation: Often includes logic for error handling or data validation checks.
- Input/Output Specifics: Data flows are highly specific to the sub-process.
- Consistency: Must strictly follow the balancing rules relative to its parent process in Level 1.
For example, if Level 1 has a process called “Process Loan Application,” Level 2 might break this down into “Verify Income,” “Check Credit Score,” and “Approve or Reject.” Each of these would have its own inputs and outputs.
Comparing the Levels 📊
Understanding the differences between the levels is crucial for maintaining the integrity of your documentation. The following table outlines the distinctions.
| Feature | Level 0 (Context) | Level 1 (Major Functions) | Level 2 (Detailed) |
|---|---|---|---|
| Scope | Entire System Boundary | Major Sub-Systems | Specific Logic Steps |
| Process Count | 1 (System Name) | 5 to 9 Major Processes | Variable (Per Complex Process) |
| Data Stores | None | High-level Repositories | Specific Tables/Files |
| Primary Audience | Stakeholders / Management | Analysts / Developers | Programmers / QA |
| Detail Level | Low | Medium | High |
The Balancing Rule 🎯
One of the most critical concepts in DFD hierarchy is Balancing. Balancing ensures that data flows are consistent across levels. If a data flow enters a process at Level 0, it must enter the corresponding decomposition at Level 1. If a data flow leaves a process at Level 1, it must leave the corresponding process at Level 2.
Why Balancing is Essential
- Consistency: Prevents data from appearing or disappearing magically.
- Completeness: Ensures all required inputs and outputs are accounted for.
- Traceability: Allows auditors to verify that the detailed logic matches the high-level requirements.
How to Check for Balancing
- Identify the process in the higher-level diagram.
- List all inputs entering and outputs leaving that process.
- Identify the sub-processes in the lower-level diagram that replace the higher-level process.
- Verify that the sum of inputs to the sub-processes equals the input to the parent process.
- Verify that the sum of outputs from the sub-processes equals the output from the parent process.
If you find a data flow in Level 1 that does not exist in Level 0, you have created a “Miracle Process”. Conversely, if an input exists in Level 0 but disappears in Level 1, you have a “Black Hole”. Both are errors.
Naming Conventions for Clarity 🏷️
Clear naming is the backbone of readable DFDs. Ambiguous labels lead to misinterpretation and implementation errors.
Process Names
Processes should be named using a Verb-Noun structure. This indicates an action being performed on data.
- Good: “Validate User Input”, “Generate Report”, “Update Inventory”.
- Bad: “User Input”, “Report”, “Inventory”.
Use consistent verbs across levels. If Level 0 is “Process Order”, Level 1 sub-processes should not use unrelated verbs like “Handle Order” or “Deal with Order”. Stick to “Process Order” or “Manage Order” consistently.
Data Flow Names
Data flows represent the movement of data. They should be named with Nouns or Noun Phrases. They describe what is moving.
- Good: “Customer ID”, “Sales Invoice”, “Payment Details”.
- Bad: “Input Customer ID”, “Sending Invoice”.
Data Store Names
Data stores represent where data rests. They should be named to reflect the content of the repository.
- Good: “Customer File”, “Order Log”, “Product Catalog”.
- Bad: “DB1”, “Table 1”, “Main Data”.
Common Pitfalls and Errors ⚠️
Even experienced analysts make mistakes when constructing DFD hierarchies. Being aware of these common pitfalls helps maintain diagram quality.
1. The Black Hole
A process that has inputs but no outputs. It suggests data is being consumed without producing a result. This is logically impossible in a functioning system.
2. The Miracle Process
A process that has outputs but no inputs. It implies data is being created from nothing. While some processes might generate timestamps, the data itself must have a source.
3. Data Flow Crossing
Avoid having data flows cross over other processes or data stores. Use orthogonal lines (right angles) to keep the diagram clean. Crossing lines create visual confusion.
4. External Entities in the Middle
External entities must remain on the periphery. If an entity appears inside the system boundary, it is no longer external; it is part of the system.
5. Unnecessary Data Stores
Do not add a data store just to connect two processes. If data flows directly from Process A to Process B, a data store is not required unless the data needs to be persisted.
Maintaining the Hierarchy 🔄
Systems evolve. Requirements change. A static DFD becomes obsolete quickly. Maintaining the hierarchy requires a disciplined approach.
Version Control
Every change to a diagram should be versioned. When a process changes at Level 1, you must check if it impacts Level 0 or Level 2. Changes rarely happen in isolation.
Review Cycles
Regularly review the hierarchy with stakeholders. Level 0 diagrams are best for executive reviews. Level 1 and 2 diagrams are best for technical reviews.
Documentation Links
DFDs are rarely standalone. They should link to detailed requirements or logic specifications. Use the Level 2 diagrams to anchor specific business rules.
Conclusion on Hierarchy 👥
The hierarchy of Data Flow Diagrams is not just a drawing exercise. It is a method for managing complexity. By moving from Level 0 to Level 2, you transition from a strategic overview to tactical implementation details.
Level 0 defines the boundary. Level 1 defines the function. Level 2 defines the logic. When these levels are balanced and named consistently, they provide a robust map for development teams and a clear view for stakeholders. Adhering to these standards ensures that the system design remains coherent as it grows.
Remember, the goal is communication. If the diagram cannot be understood by the team building the system, it has failed its purpose. Use the hierarchy to simplify, not to complicate.