dfd

DFD

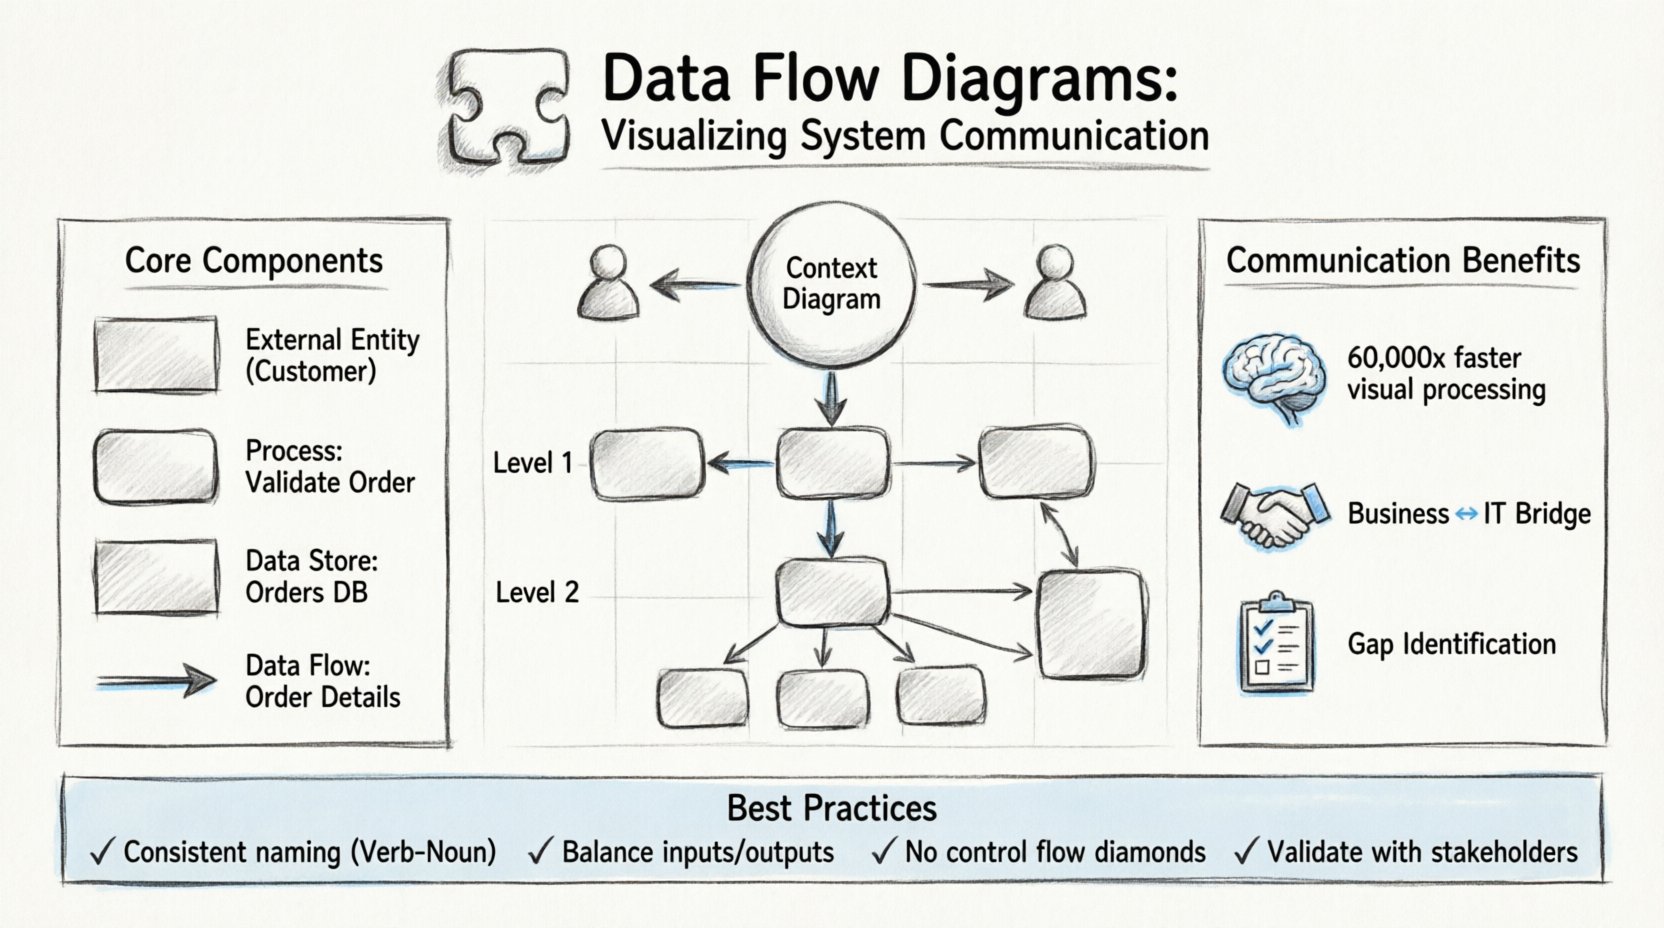
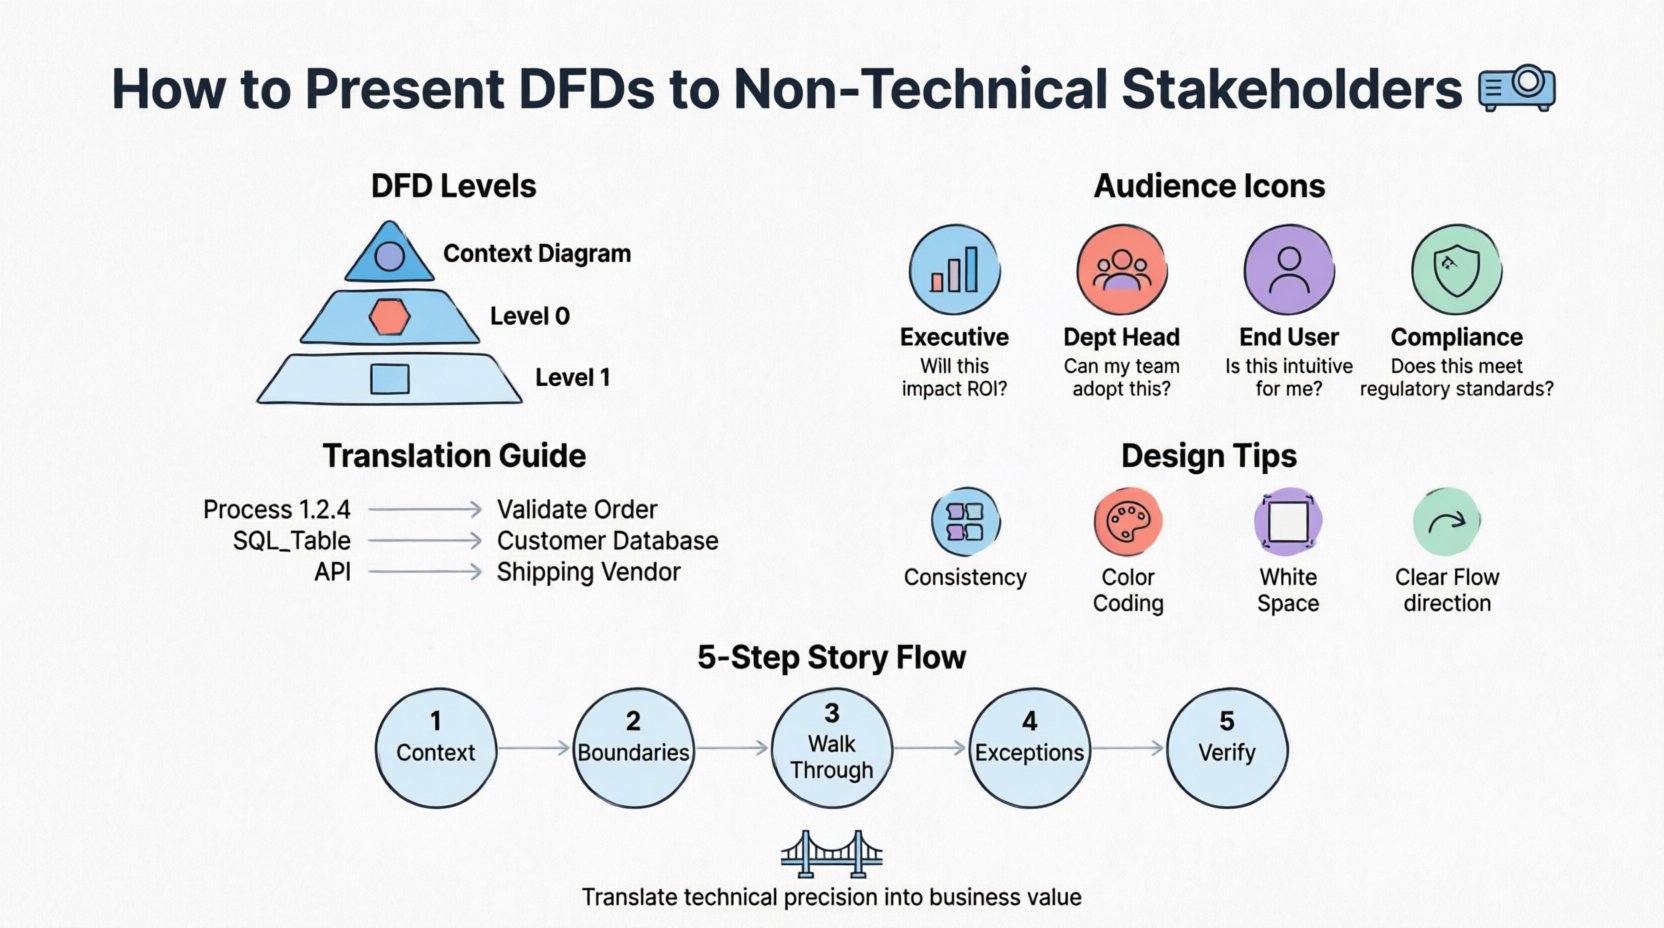
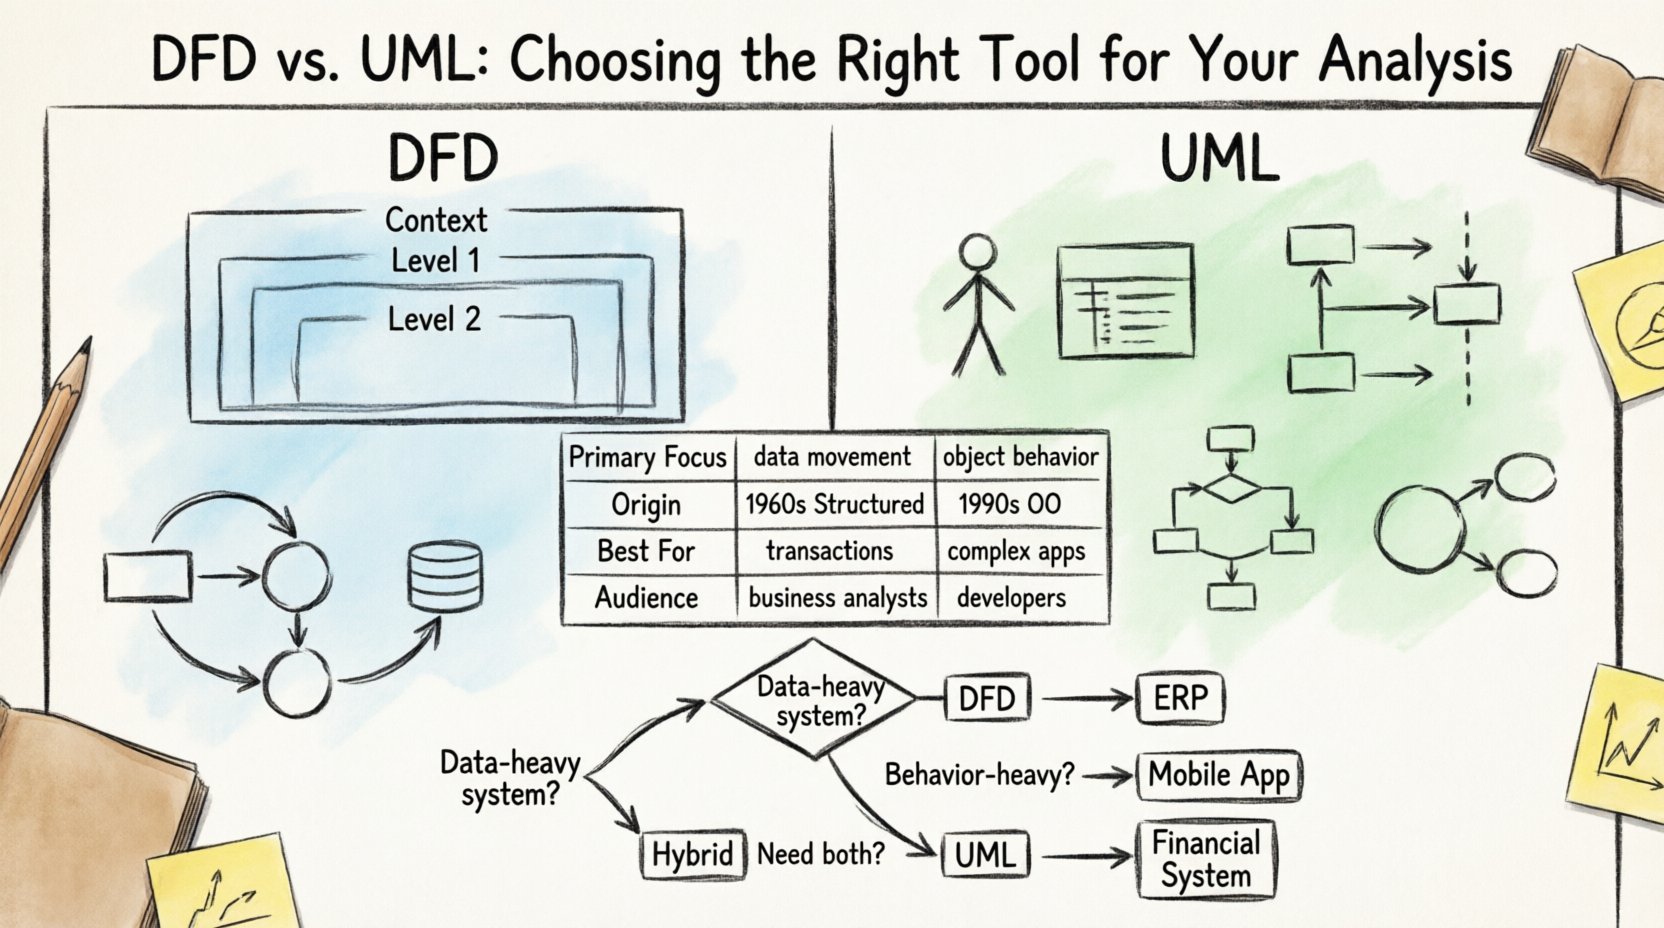
DFD vs. UML: Choosing the Right Tool for Your Analysis

In the landscape of system design and software engineering, selecting the appropriate modeling notation is a critical decision. It dictates how requirements are captured, how logic is visualized, and how information flows between stakeholders. Two dominant methodologies stand out: the Data Flow Diagram (DFD) and the Unified Modeling Language (UML). While both aim to represent […]

DFD

Expert Tips for Refining Data Flow Diagrams in Large-Scale Projects

Large-scale software systems and complex organizational processes rely heavily on clear visual communication. When data moves across multiple departments, systems, or microservices, the risk of misunderstanding increases exponentially. This is where the Data Flow Diagram (DFD) becomes an indispensable tool. However, creating a static diagram is only the beginning. The real value lies in refining

DFD

The Future of Data Flow Diagrams in Agile and DevOps Environments

Data Flow Diagrams (DFDs) have long served as the backbone of system analysis and design. They provide a clear visual representation of how data moves through a system, identifying processes, data stores, and external entities. However, as software delivery accelerates and methodologies shift towards Agile and DevOps, the role of these diagrams is undergoing a

DFD

Troubleshooting Complex Systems with Strategic Data Flow Analysis

Modern infrastructure operates at a scale that defies intuition. Systems span multiple environments, integrate disparate services, and process vast quantities of information every second. When something breaks, the noise is deafening. Logs flood dashboards, alerts cascade, and the root cause remains obscured by layers of abstraction. To navigate this complexity, engineers require a method to

DFD

Step-by-Step Tutorial: Creating Your First Professional DFD

Data Flow Diagrams (DFDs) are fundamental tools in systems analysis and design. They provide a visual representation of how data moves through a system, highlighting inputs, outputs, and storage points without detailing the specific logic or timing. For professionals entering the field of business analysis or software architecture, understanding how to construct a DFD is

DFD

The Impact of Well-Structured DFDs on Project Timelines

In the complex landscape of software development and system analysis, time is a finite resource that often slips away unnoticed. Projects frequently face delays not because of coding inefficiencies, but due to a fundamental misunderstanding of requirements. This is where the Data Flow Diagram (DFD) becomes a critical asset. A well-structured DFD does more than

DFD

Case Studies: Real-World Success Stories Using DFDs

Data Flow Diagrams (DFDs) serve as a critical blueprint for understanding how information moves through a system. Unlike structural diagrams that focus on static relationships, DFDs visualize dynamic processes, data stores, and external entities. This visual language is essential for analysts, developers, and business stakeholders to align on system functionality. By mapping out the flow

DFD

Common Pitfalls in Data Flow Diagramming and How to Avoid Them

Data Flow Diagramming (DFD) remains a cornerstone of structured system analysis. It provides a visual representation of how information moves through a system, identifying processes, data stores, external entities, and the data flowing between them. Despite its widespread adoption, creating a precise and functional DFD requires rigorous adherence to established conventions. Deviations from these norms

DFD

Visualizing Data: How DFDs Improve System Communication

In the complex landscape of software development and system analysis, clarity is often the missing link between a successful project and a failed one. When teams struggle to understand how information moves through an application, misunderstandings arise, leading to rework, bugs, and delayed delivery. This is where the Data Flow Diagram, commonly known as the

DFD

How to Present DFDs to Non-Technical Stakeholders Effectively

Presenting technical artifacts to business teams is a critical skill for any systems analyst or data architect. One of the most common challenges involves the Data Flow Diagram (DFD). While DFDs are powerful tools for mapping system logic, they often appear as complex charts filled with jargon to those outside the engineering department. To bridge

Scroll to Top