

6-Aspects Infographic for PESTLE Visualization
Visual Paradigm’s 6-Aspects Infographic Designer is purpose-built for six-factor frameworks like PESTLE, allowing you to transform detailed analyses into engaging, high-quality infographics with AI assistance. This tool excels at visualizing Political, Economic, Social, Technological, Legal, and Environmental factors in a balanced, professional layout.
Ideal for strategic leaders, it streamlines the shift from raw insights to presentation-ready visuals, saving time while elevating communication in boardrooms, reports, and consulting deliverables.
Overview of the 6-Aspects Infographic Designer
This AI-powered tool supports frameworks requiring exactly six dimensions—such as PESTLE, 6C, or Six Thinking Hats—with an extensive library of customizable layouts, from clean grids to dynamic holographic designs.
It generates infographics directly from your topic or input, producing editable content that you can refine for precision and branding.
Steps to Create PESTLE Infographics
Access the tool at ai.visual-paradigm.com/tool/6-aspects-infographic-designer/ or through Visual Paradigm’s AI toolbox.
Selecting the Framework and Input
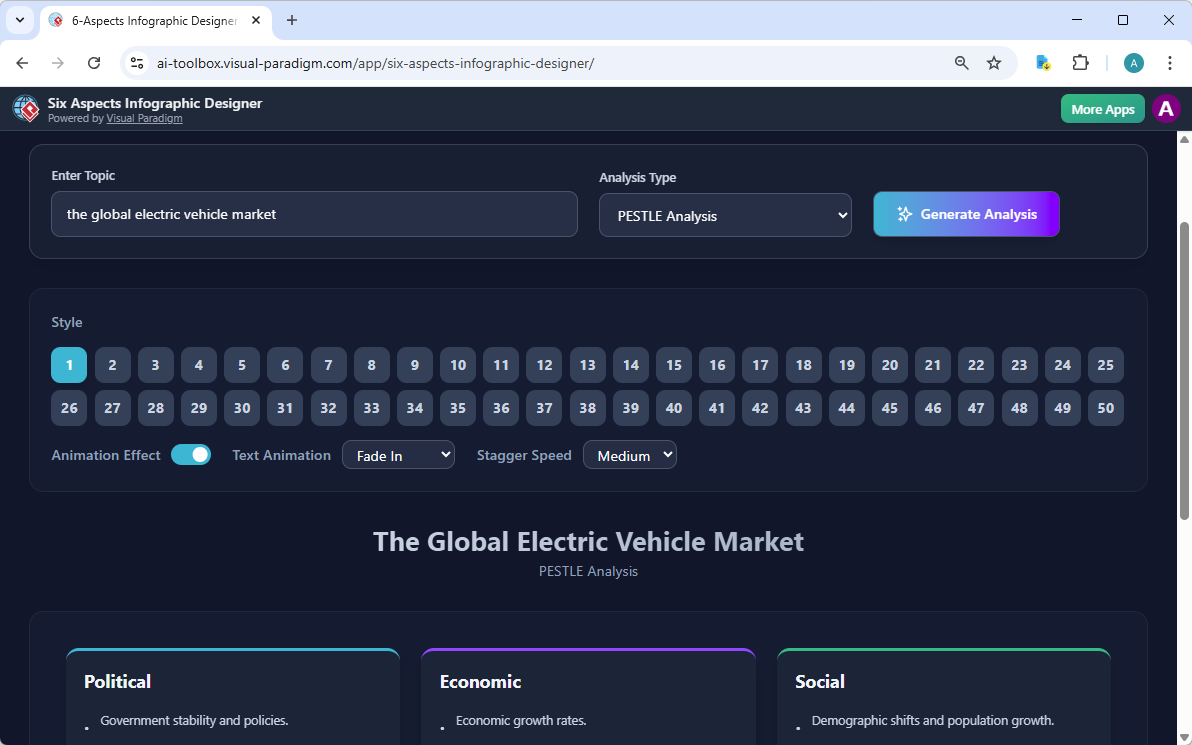
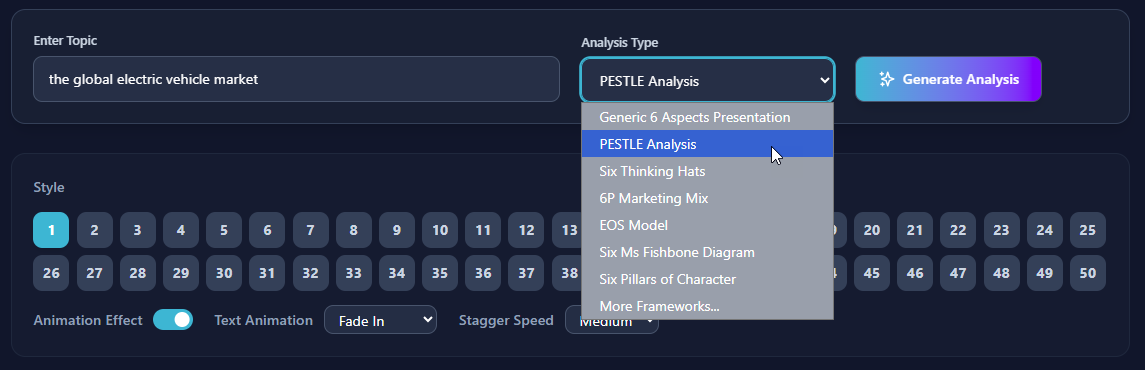
Choose the PESTLE (or 6-aspect generic) framework from the Analysis Type.
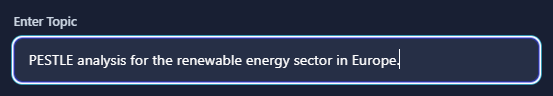
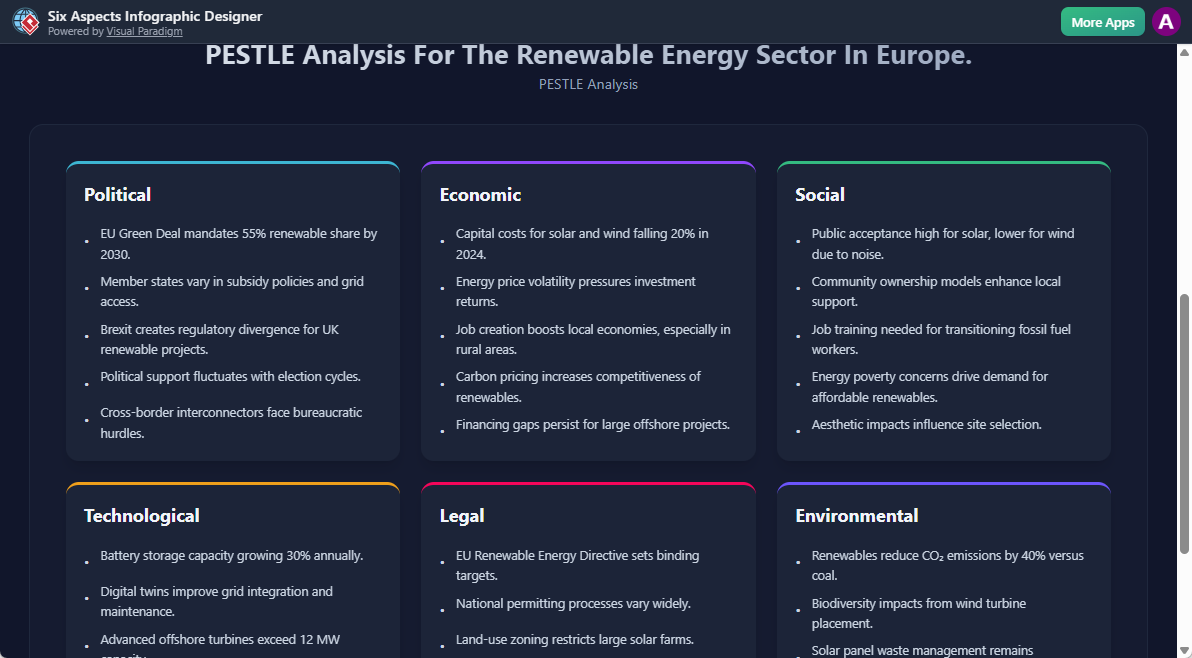
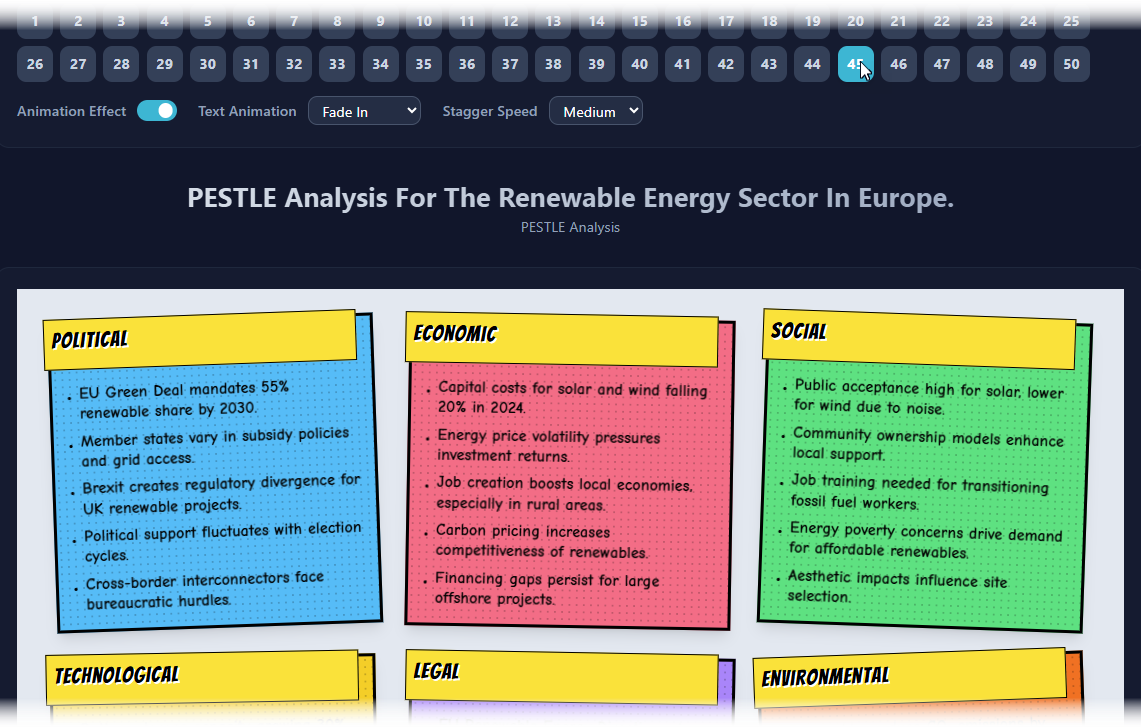
Enter your topic, e.g., “PESTLE analysis for the renewable energy sector in Europe.”. Click Generate Analysis.
The AI rapidly generates structured content with dedicated sections for each of the six factors, complete with key bullet points and insights.
Editing and Customization
Review the AI output and edit titles, bullet points, or add supporting data to ensure accuracy and depth. Adjust emphasis on critical factors like Environmental or Legal based on your strategic focus.
Select from the 50 visual styles to match your audience—professional for executive summaries or creative for stakeholder workshops.
Export and Integration
Export the finished infographic as PNG for seamless inclusion in presentations, reports, emails, or strategy documents.
Practical Tips for Effective Use
Provide detailed prompts or existing analysis text as input to get richer, more accurate AI-generated content from the start.
Experiment with multiple layouts to find the one that best highlights interconnections between PESTLE factors, improving stakeholder understanding.
Always cross-validate AI suggestions with your expertise, especially for nuanced or region-specific legal/environmental elements.
Frequently Asked Questions
Why use the 6-Aspects Designer specifically for PESTLE?
It matches PESTLE’s exact six factors perfectly, delivering balanced, visually appealing layouts without forcing adaptation from 4- or 5-aspect tools—ensuring each element gets equal prominence.
What are the key benefits for strategic leaders?
It accelerates visualization of complex analyses, produces professional-grade outputs instantly, and enhances clarity in governance, planning, and decision-making communications.
Can I fully customize the generated PESTLE infographic?
Yes— the text are all editable. You can also select a visual style to fit your executive or consulting needs.
